Fig. 3.

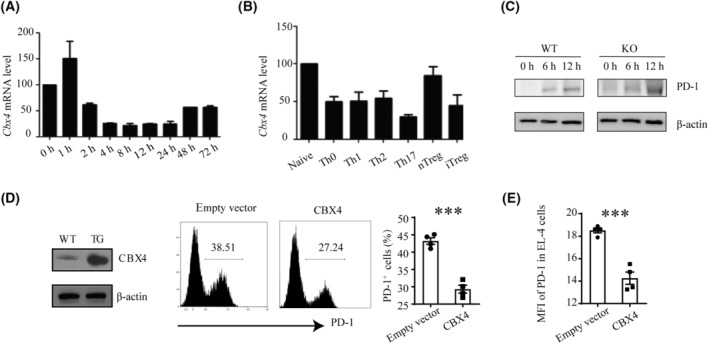
Inhibition of PD‐1 expression by CBX4. (A) Relative levels of Cbx4 mRNA expression in naïve (0 h) versus TCR‐stimulated CD4+ T cells at different time points as measured by quantitative RT‐PCR. Data from three independent experiments are shown. Error bars indicate SEM. (B) Relative levels of Cbx4 mRNA expression in naïve T cells, naturally occurring Treg (nTreg) cells, and effector T cells generated under various polarizing conditions for 72 h. The experiment was repeated three times. (C) Naive CD4+ T cells from WT and KO mice were stimulated with anti‐CD3 (2 μg·mL−1) and anti‐CD28 (1 μg·mL−1) for 12 h. PD‐1 levels were detected 6 h and 12 h after stimulation by western blotting (n = 2). (D) Jurkat cells were transfected with Myc‐CBX4 or empty vectors. CBX4 expression was verified western blotting (left). Following stimulation with anti‐CD3 (2 μg·mL−1) and anti‐CD28 (1 μg·mL−1) for 24 h, PD‐1 expression in the transfectants was detected by flow cytometry (n = 4). (E) EL‐4 cells were transfected with Flag‐CBX4 or empty vectors. Following stimulation with anti‐CD3 (2 μg·mL−1) and anti‐CD28 (1 μg·mL−1) for 24 h, PD‐1 expression in the transfectants was detected by flow cytometry (n = 4). Representative histograms are shown in the middle. Statistical data are presented as Mean ± SE Each experiment was repeated at least three times. Unpaired t‐test was used for comparison, ***P < 0.001.
