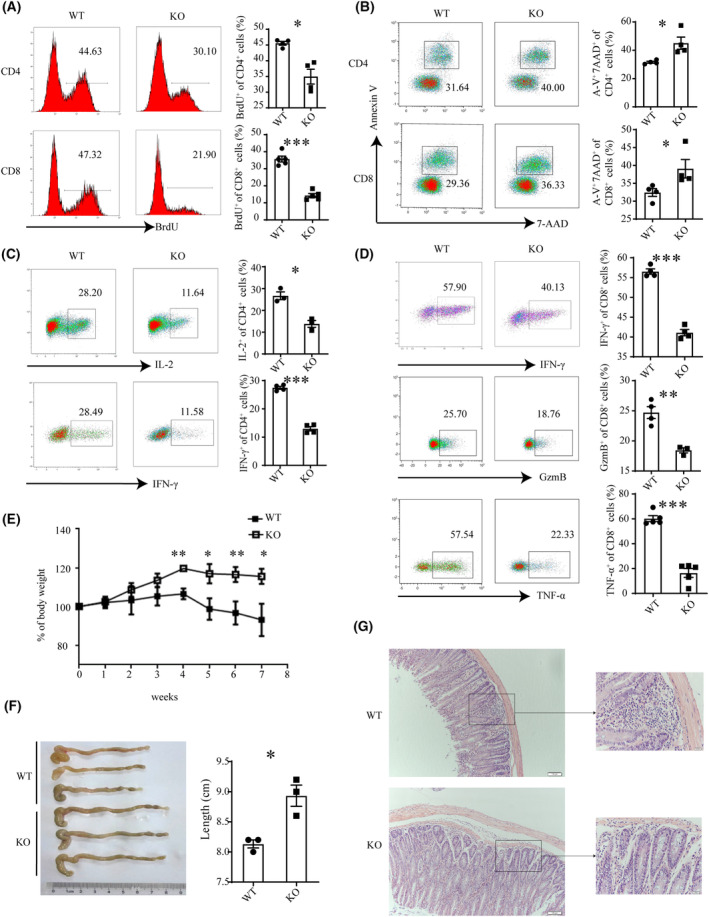
Fig. 4.

Activation defects of Cbx4‐deficient T cells. Naive CD4+ and CD8+ T cells from WT (wild‐type) and KO (knockout) mice were stimulated with anti‐CD3 (2 μg·mL−1) and anti‐CD28 (1 μg·mL−1) for 72 h. (A–D) Cell proliferation was measured by BrdU incorporation (A). Cell survival was analyzed with Annexin V and 7‐AAD staining (n = 4) (B). IL‐2 and IFN‐γ production by CD4+ T cells (n = 4) (C) and IFN‐γ, GzmB, and TNF‐α expression by CD8+ T cells (n = 4) (D) was examined by flow cytometry. Representative histograms (left) and statistical data (right) from three to four independent experiments are shown. (E–G) Body weight of Rag1 −/−recipient mice given wild‐type or Cbx4 KO CD4+CD45RBhi naïve T cells were adoptively transferred into Rag1 −/−recipient mice (n = 3 for each group). Body weight was monitored weekly (E). At the end of experiment, colon length was recorded (F) and the colonic sections were examined by HE staining (scale bar = 1 cm) (G). Scale bar = 100 μm. Data are presented as Mean ± SE. Unpaired t‐test was used for comparison, *P < 0.05, **P < 0.01, ***P < 0.001.
