

Summary
The chromodomain family member chromodomain 1 (CHD1) has been shown to have numerous critical molecular functions including transcriptional regulation, splicing, and DNA repair. Complete loss of function of this gene is not compatible with life. On the other hand, missense and copy number variants of CHD1 can result in intellectual disabilities and craniofacial malformations in human patients including cleft palate and Pilarowski–Bjornsson Syndrome. We have used the aquatic developmental model organism Xenopus laevis, to determine a specific role for Chd1 in such cranioafcial disorders. Protein and gene knockdown techniques in Xenopus, including antisense oligos and mosaic Crispr/Cas9-mediated mutagenesis, recapitulated the craniofacial defects observed in humans. Further analysis indicated that embryos deficient in Chd1 had defects in cranial neural crest development and jaw cartilage morphology. Additionally, flow cytometry and immunohistochemistry revealed that decreased Chd1 resulted in increased in apoptosis in the developing head. Together, these experiments demonstrate that Chd1 is critical for fundamental processes and cell survival in craniofacial development. We also presented evidence that Chd1 is regulated by retinoic acid signaling during craniofacial development. Expression levels of chd1 mRNA, specifically in the head, were increased by RAR agonist exposure and decreased upon antagonist treatment. Sub-phenotypic levels of an RAR antagonist and Chd1 morpholinos synergized to result in orofacial defects. Further, RAR DNA binding sequences (RAREs) were detected in chd1 regulatory regions by bioinformatic analysis. In summary, by combining human genetics and experiments in an aquatic model we now have a better understanding of the role of CHD1 in craniofacial disorders.
Keywords: CHD1, copy number variants, craniofacial development, Pilarowski–Bjornsson Syndrome, retinoic acid, Xenopus laevis
1 |. INTRODUCTION
Craniofacial deformities are some of the most socially and functionally devastating birth defects. Although many studies have focused on the most common craniofacial birth defect, cleft lip and/or palate (CL/P), less is known about the many rare syndromic disorders affecting the face. One such newly identified syndrome, Pilarowski–Bjornsson Syndrome (OMIM 617682, PILBOS), is a disorder that is characterized by developmental delay, speech apraxia, intellectual disability, and craniofacial defects that primarily affect the midface (Pilarowski et al., 2017). PILBOS is an autosomal dominant syndrome caused by heterozygous missense variants in the CHD1 gene. In a recent case study, a large 8.5 Mb deletion overlapping multiple genes (including CHD1) within cytobands 5q15–5q21.2 segregated in multiple members of a family displaying speech delay and dysmorphic facial features (Zepeda-Mendoza, Goodenberger, Kuhl, Rice, & Hoppman, 2019). Since the clinical features presented by these patients overlapped significantly with those with PILBOS, the deletion of CHD1 was identified as the most likely cause of the defects. Importantly, CHD1 has never been described as a gene involved in craniofacial development, therefore the major goal of the present work is to determine a role for CHD1 in orofacial formation.
CHD1 is a member of the chromodomain helicase DNA binding protein family that share chromatin organizing domains (reviewed in [Hall & Georgel, 2007]). Chromodomain proteins, including CHD1, have roles in transcriptional modulation, splicing, and DNA repair (reviewed in [Hall & Georgel, 2007; Zhou et al., 2018]). Since CHD1 is so critical to such fundamental molecular processes in the cell, it is no surprise that mice lacking two functional copies of this gene die before gastrulation (Guzman-Ayala et al., 2015; Suzuki et al., 2015). But, unlike humans, mice missing only one copy of CHD1 appear normal. Thus, mouse mutants have not yet been generated that can model CHD1 deficiency in humans. Further, it has therefore not been possible to study the role of CHD1 in craniofacial development.
Animal models have been effectively utilized to uncover the role of other members of the CHD family. For example, mutations in CHD7 cause CHARGE syndrome (OMIM 608892) a disorder that includes craniofacial defects such as a square-shaped face, a broad nasal bridge, a small mouth, and cleft lip and/or cleft palate (Bajpai et al., 2010; Zentner, Layman, Martin, & Scacheri, 2010). Mouse, zebrafish, chicken, and Xenopus models have been effective in uncovering a role for Chd7 in specification and migration of the cranial neural crest, a tissue that is instrumental to craniofacial development (Aramaki et al., 2007; Bajpai et al., 2010; Pauli, Bajpai, & Borchers, 2017; Sperry et al., 2014). Similarly, mutations in CHD8 can result in a host of craniofacial anomalies in humans such as hypertelorism, down-slanted palpebral fissures, and pointed chin (Bernier et al., 2014; Platt et al., 2017; Yasin et al., 2019). In mice and Xenopus, Chd8 has been shown to inhibit Wnt signaling, interact with Chd7, and regulate both cell cycle and histone modifications (Katayama et al., 2016; Platt et al., 2017). Importantly, these studies of other CHD family members present the possibility that CHD1 could also be integral in craniofacial development. Further, animal models, especially the aquatic model Xenopus, has been instrumental in understanding the developmental roles of Chd proteins in craniofacial development.
Craniofacial development is orchestrated by interactions between the cranial neural crest, mesoderm, endoderm, and epithelia (Cordero et al., 2011; Francis-West, Robson, & Evans, 2003; Gitton et al., 2010; Helms, Cordero, & Tapadia, 2005). Such interactions are required for morphogenesis as well as growth and differentiation of the facial structures such as bones, cartilages, muscles, and skin (Michailovici, Eigler, & Tzahor, 2015; Rose, 2009). These processes are regulated by a complex network of epigenetic regulators, transcription factors and signaling pathways. One such signaling pathway that modulates multiple aspects and stages of facial development is retinoic acid (Brickell & Thorogood, 1997; Dickinson, 2016; Kennedy & Dickinson, 2012; Maden, 1999; Mark et al., 1995; Mark, Ghyselinck, & Chambon, 2004; Williams & Bohnsack, 2019). Humans carrying mutations or copy number variants (CNVs) overlapping retinoic acid receptors have defects in the upper lip and palate as well as changes in the shape of the midface (e.g., OMIM 180220, [Johnston & Bronsky, 1995]). These abnormalities are mimicked in vertebrate animal models such as mice and Xenopus (Dickinson, 2016; Dupe & Pellerin, 2009). Work in these and other models have allowed for a better understanding of the role of retinoic acid signals during midface development. For example, studies in the aquatic model Xenopus demonstrate that retinoic acid signaling is required for expression of homeobox genes lhx8 and msx2 in the upper facial mesenchyme and together these are necessary for cell division and differentiation of the tissues that form the primary palate and upper jaw (Kennedy & Dickinson, 2012). Transcriptomics and network analyses in this model also suggest that retinoic acid signals are necessary for the expression of epigenetic regulators, including chd1 (Wahl, Wyatt, Turner, & Dickinson, 2018). Therefore, another goal of this work is to test the hypothesis that chd1 is regulated by retinoic acid during midface development. By doing so we aim to understand how this epigenetic regulator fits into the network of signals that modulate craniofacial development.
In the present study, we identify a heterozygous deletion overlapping CHD1 in an individual with nonsyndromic cleft lip and cleft palate. Then, using Xenopus, we demonstrate that Chd1 is required for cranial neural crest migration and survival of cells in the developing head. Finally, we use this animal model to provide evidence that retinoic acid signaling regulates chd1 expression in the developing face, putting this epigenetic modulator into a known network of orofacial regulators. This work is the first step toward a better understanding of the mechanisms by which retinoic acid signaling and Chd1 mediate craniofacial development.
2 |. METHODS
2.1 |. Human structural variation analysis
Rare deletions, overlapping protein coding genes were identified using array-based comparative genomic hybridization in 1102 patients with cleft lip and/or cleft palate (Manak and Murray Labs, study to be published elsewhere). All participants included in this study were recruited following signed informed consent obtained in compliance with Institutional Review Board (IRB) No. 199804081 (Philippines) and IRB No. 199804080 (IA). All variants identified were compared with a curated list of CNVs derived from the Database of Genomic Variants Gold Standard list (see [Lansdon et al., 2018]) to determine calls enriched in cases versus controls. In addition, the DECIPHER database (https://decipher.sanger.ac.uk [Firth et al., 2009]), the Clinical Genome (ClinGen) Resource (https://www.clinicalgenome.org/ [citation is PMID:26014595]), the ClinVar database (https://www.ncbi.nlm.nih.gov/clinvar/ (citation is PMID:29165669) and the local CNV database of the Shivanand R. Patil Cytogenetics and Molecular Laboratory at the University of Iowa were utilized to assess the frequency of CNVs overlapping CHD1 in patient populations as well as the presence of craniofacial phenotypes. The Broad’s gnomAD database was used to predict gene constraint (https://gnomad.broadinstitute.org, [Karczewski et al., 2019]).
2.2 |. Animals
Xenopus laevis embryos were obtained using standard procedures (Sive, Grainger, & Harland, 2000) approved by the VCU Institutional Animal Care and Use Committee (IACUC protocol number AD20261). Embryos were staged according to Nieuwkoop and Faber (Nieuwkoop & Faber, 1994). Stages are also reported as hours postfertilization at 23°C for better comparisons across vertebrates.
2.3 |. RAR antagonist and agonist treatments
Embryos, at the appropriate stage, were placed in six well culture dish wells in 4 ml of 0.1X MBS with the indicated concentrations of BMS-453 (Tocris, cat # 3409), TTNPB, (Tocris, cat # 0761) with 1% DMSO. At the end of the treatments, embryos were processed for RT-PCR or imaging described below.
2.4 |. In situ hybridization
DIG-labeled RNA probes for chd1 were prepared from a plasmid containing a partial, sequence for Xenopus chd1.L (Dharmacon, MXL1736–202727035, Clone ID: 6643113, Genbank #: BC094094) that also had considerable stretches of 100% sequence similarity with chd1.S (overal similarity =95%; see Supporting Information). The plasmid was linearized, gel purified and transcribed with DIG RNA labeling mix with either T7 RNA polymerase (NEB, cat # M0251S; antisense probe), or SP6 RNA polymerase (NEB, cat # M0207S; sense probe). The probe was then hydrolyzed by combining it (1 μg) with 40 mM sodium bicarbonate and 60 mM sodium carbonate for 60 min at 60°C. This was followed by precipitation with sodium acetate and ethanol solution (25 μl 3 M sodium acetate, 200 μl water, 600 μl ethanol) centrifuged and re-suspended in nuclease-free water (Sive et al., 2000). By creating these shorter sequences of probe, we predicted that it would better detect both chd1.S and chd1.L mRNA in the embryos. Tfap-2α DIG-labeled RNA probes were created as described previously (Wahl et al., 2015). Embryos used for in situ hybridization were fixed in 4% PFA, dehydrated in a methanol series and stored for 1–10 days at −20°C. In situ hybridization was performed as described (Sive et al., 2000), omitting the proteinase K treatment. After staining, a subset of embryos were refixed in PFA, embedded in 4% low melt agarose and sectioned at 100–200 μm using a vibratome (Leica).
2.5 |. Chd1 morpholinos
Antisense morpholinos (MOs) were designed and purchased from GeneTools (sequences in Table S1). Chd1.SMO1 is a splice blocking MO targeting only chd1.S while Chd1MO2 is a translation blocking MO targeting both chd1.L and chd1.S. A standard control MO was obtained from GeneTools. All MOs were labeled with fluorescein. Note that Chd1MO2 was more difficult to dissolve after first use and therefore required multiple rounds of heating at 65°C. Microinjections were performed using an Eppendorf Femtojet microinjector and a Zeiss Discovery V8 stereoscope. Embryos were placed in a dish lined with nylon Spectra mesh (1,000 μm opening and 1350 μm thickness) at the bottom to hold embryos in place and filled with 3% Ficoll 400 (Fisher, cat # BP525) dissolved in 0.1X MBS.
2.6 |. Chd1 Crispr/Cas9 mutagenesis
chd1 sgRNA was designed using the ChopChop software. A sequence was chosen that targeted both the Long and Short alloalleles with no off-targets and efficiency of ~0.65 (see Table S1). The chd1 sgRNA was purchased from Synthego and diluted as recommended in low EDTA TE buffer. Then, 200 pg of chd1 Crispr was incubated with 2 pg of Cas9 protein (PNA Bio Inc., cat # CP01) for 10 min and then injected into each embryo. A negative control consisted of the same concentrations of the negative control sgRNA (designed and synthesized by Synthego) and Cas9 protein. Positive controls consisted of the same concentration of a sgRNA that targeted slc45a2, also combined with the same concentration of Cas9 protein. The sgRNA targeting slc45a2 effectively decreases pigment in the embryo serving as an easy marker to ensure the techniques and reagents were effective (DeLay et al., 2018).
DNA was isolated from individual embryos using Hotshot DNA Prep protocol. Each embryo was immersed in 40 μl of an alkaline lysis buffer (25 mM NaOH, 0.2 mM Na-EDTA) and heated for 40 min at 95°C. The solution was then cooled and an equal volume of neutralization buffer (40 mM Tris–HCL) was added. One micro liter of this solution was used in a standard PCR reaction with Hotstart Taq master mix and primers that flanked the predicted mutation site (Table S1). The product was then sent for purification and sequencing at Genewiz using the same primers. 1 μl of the hotshot prepped DNA was also combined with the SensiFAST HRM Mix (BIO-32005) and primers (Table S1) and high resolution melt (HRM) protocol on the Bioline Mic qRT-PCR machine was utilized where 40 cycles (95°C for 5 s, 60°C 12 s) were performed followed by a melt from 68°C to 95°C at 0.025°C/s.
2.7 |. RT-PCR
Embryos were anesthetized in 1% tricaine and then the heads removed by microdissection and placed in Trizol on ice (Ambion, cat # 15596026). RNA was extracted following the manufacturer’s instructions followed by lithium chloride solution precipitation (Ambion, cat # AM9480). One micro gram of RNA was used to synthesize cDNA using the Qiagen Quantitect reverse transcription kit (Qiagen, cat # 205311) or the Biosystems high capacity cDNA reverse transcription kit (Thermofisher, cat # 4368814). qRT-PCR was performed with SensiFAST SYBR No-Rox (Bioline cat # BIO-98002) on a Bio-Rad CFX96 real-time PCR system or Bioline Mic qPCR machine. All primer sequences are provided in Table S1. The relative amounts of amplification were calculated using the delta–delta CT method and were normalized to expression levels of GAPDH or actin.
To determine if Chd1.SMO1 resulted in splicing defects, primers were designed to flank exon 2 where the splicing defect was predicted to occur (Primer sequences provided in Table S1. PCR was performed with Apex Hotstart Taq master mix (Bioline, cat # 42–144) on a BioRad MJ Mini Personal Thermocycler. The PCR products were analyzed on a 2% agarose gel prepared with molecular grade agarose (Bioline, cat # BIO-41025) in TAE buffer.
2.8 |. Quantification of faces
Embryos were imaged using a Zeiss stereoscope fitted with an axiovision digital camera as described (Kennedy & Dickinson, 2014a). The intercanthal distance was determined by measuring the distance between the eyes. The mouth width was determined by measuring the distance between the corners of the mouth. Axiovision software (Zeiss) was used to measure these distances. Morphometric analysis was performed as previously described (Kennedy & Dickinson, 2014a). Twenty-seven landmarks were chosen to represent the shape of the face for geometric morphometric analysis. These landmarks were placed on images of the embryo faces by utilizing the point picker plugin of the ImageJ software (NIH). The coordinates of these landmarks were statistically analyzed in the MorphoJ software (Klingenberg, 2011) to align the data by Procrustes fit and eliminate information about scale, size, position, and orientation. A principal component analysis (PCA) displayed as a scatter plot was used to illustrate the relationship between individuals. A discriminant function analysis displayed on a transformation grid was used to show the differences in landmark locations between two groups.
2.9 |. RARE analysis of chd1 sequences
The 20 kb sequence upstream of the transcription start site, as well as within introns and 3′UTR of the chd1 gene was retrieved from xenbase.org. This sequence was scanned for a consensus RARE sequence 5′-RGKTCA-(n)1,2,5-RGKTCA-3′ (Lalevee et al., 2011). A custom Python code was created to scan the sequences.
2.10 |. Immunofluorescence and immunohistochemistry
Embryos were fixed in 4% PFA and then either processed for immunohistochemistry or immunofluorescence. For the latter, embryos were immersed in 5% low melt agarose and sectioned with a vibratome. Sections were incubated with block (1% normal goat serum and 5% BSA) for 24 hr followed by 1:500 CHD1 polyclonal antibody (1:500, Active Motif, 39729) for 48 hr followed by secondary incubation (1:500, goat-anti rabbit Alexa Fluor 488), for 24 hr Images were collected with a C2 Nikon confocal microscope. For immunohistochemistry whole embryos were blocked (1% normal goat serum and 5% BSA), incubated in anti-cleaved caspase3 (1:1,000, Cell Signaling, 9661), followed by secondary (1:5,000, goat-anti rabbit alkaline phosphatase, 24 hr). The colorimetric reaction was performed with an NBT/BCIP tablet dissolved in 10 ml of AP buffer. Images were captured with a Zeiss stereoscope.
2.11 |. Flow cytometry
The heads of 50 embryos per sample were microdissected and collected in 1X MBS on ice. The head tissues were mechanically digested in 0.5X calcium free Ringer’s solution (58 mM NaCl, 1.45 mM KCl, 2.5 mM HEPES, pH 7.2). This was followed by incubation in 0.25% Trypsin/EDTA (Sigma T4049) and 5 mg/ml collagenase type 2 (Worthington, LS004174) for 20 min at 37°C. The suspension was passed through a 40 μm cell strainer (Greiner Bio-One 542040) and centrifuged at 3000 rpm for 2 min at 4°C. Cells were resuspended in 5% goat serum in 1X PBS and centrifuged at 3,000 rpm for 2 min at 4°C. Finally, cells were labeled with propidium iodide staining solution (100 mM Tris pH 7.5, 154 mM NaCl, 1 mM CaCl2, 0.5 mM MgCl2, 0.2% Bovine Serum Albumin (BSA), 0.1% Nonidet P-40, 86 μg/ml RNAse A (Thermoscientific EN0531), and 20 μg/ml propidium iodide) for 1 hr. Cells were passed through a cell strainer prior to analysis on the flow cytometer. Cells were analyzed with a Canto—BD FACSCanto II Analyzer at the VCU Flow Core.
2.12 |. Cartilage labeling
Cartilages were labeled with Alcian Blue. Tadpoles were fixed in Bouin’s fixative overnight at 4°C and then washed in 70% ethanol until clear of any yellow color. They were then immersed in Alcian Blue mixture (0.1 mg/ml Alcian Blue in 1 part acetic acid: 4 parts ethanol) for 3–4 days at room temperature. Specimens were washed in 1% HCL in 70% ethanol for 1–2 days flowed by another fixation in 4% paraformadehyde (2 hr). To remove pigment, tadpoles were immersed in 1.5% hydrogen peroxide and 5% formamide in 2X saline sodium citrate solution and placed on a light box until back spots could no longer be seen. After three washes in PBT, the embryos were incubated in 2% potassium hydroxide (2X 30 min). Finally, the embryos were cleared in a series of 2% postassium hydroxide to 100% glycerol solutions (50:50, 40:60, 20:80, 30 min each). Tadpoles were then imaged in 100% glycerol.
3 |. RESULTS
3.1 |. Human patients carrying CNVs overlapping CHD1 have craniofacial defects
CNVs that alter gene dosage have been associated with a variety of both common and rare birth defects (Glessner et al., 2009; Greenway et al., 2009; Lansdon et al., 2018; Mefford et al., 2009). To provide evidence that CNVs affecting CHD1 may be associated with craniofacial defects in humans we searched five human sequence datasets. First, we examined our dataset of CNVs generated from a large clefting cohort using high-resolution microarray-based comparative genomic hybridization ([Lansdon et al., 2018] and unpublished data). We identified a novel 854.6 Mb heterozygous deletion that included CHD1 and RGMB (Repulsive Guidance Molecule BMP Co-Receptor B). Due to the fact RGMB has no prior gene-disease associations and is not highly constrained in the gnomAD database (pLI = 0.07, o/e = 0.32 [0.16–0.74], missense z = 0.71, o/e = 0.88 [0.79–0.98]), we focused on CHD1 as the candidate gene in this interval. Intriguingly, this was the only deletion overlapping CHD1 within our large cohort of individuals with syndromic and nonsyndromic CL/P, occurring at a frequency of 0.09% (1/1102; unpublished data) and no CNVs overlapping CHD1 were detected in controls (see Section 2; Figure 1a). The affected patient was a male with nonsyndromic bilateral cleft lip and cleft palate (Figure 1b; parent samples unavailable for testing). Next, we examined publicly available CNV data in the DECI-PHER database consisting of more than 27,000 cases from 250 centers, the Clinical Genome (ClinGen) Resource, the ClinVar database and the local clinical CNV database of the Shivanand R. Patil Cytogenetics and Molecular Laboratory at the University of Iowa. In this DECIPHER dataset, five patients were identified with a deletion that included CHD1. These patients had various craniofacial abnormalities including high palate, narrow forehead and micrognathia (Table 1). Importantly, CHD1 is expected to be intolerant to loss-of-function (pLI =1; o/e = 0.09 [0.06–0.16]) and constrained against missense variation (z = 4.21; o/e = 0.59 [0.55–0.64]) according to the gnomAD database, suggesting precise expression of this gene may be critical for developmental processes. Unfortunately, no patients in over 5,000 were identified with a CHD1 deletion in the clinical CNV database of the Shivanand R. Patil Cytogenetics and Molecular Laboratory at the University of Iowa, and only one relevant deletion was identified in each of the ClinVar (RCV001005705) and ClinGen (nssv133645216) databases, however, there was either no phenotypic information available or the only phenotype available was developmental delay, respectively.
FIGURE 1.

(a) Identification of a heterozygous deletion that removes CHD1 and RGMB in a patient with bilateral cleft lip and cleft palate (CLP) using aCGH analysis. Each dot in the segmentation plot represents an oligonucleotide probe co-hybridized with case (Cy3) and control (Cy5) DNA. Probes shifted downward (highlighted in pink) represent a heterozygous deletion of the region. (b) Pedigree of patient with CNV in a
TABLE 1.
Copy number variants in CHD1
| Source/DECIPHER ID | Variant location | Deletion or duplication | Sex | Size Mb | Inheritance | Phenotype(s) defects affecting the face are bolded | Patient variants |
|---|---|---|---|---|---|---|---|
| Manak lab | 5:97991957-98846555 | Deletion | XY | 854599 kb | Cleft palate | 1 | |
| DECIPHER 249123 | 5:92889845-104990333 | Deletion | XY | 12.10 | De novo constitutive | Anteverted nares, hypsarrhythmia, intellectual disability, seizures, Upslanted palpebral fissure | 1 |
| DECIPHER 256750 | 5:91687088-99394160 | Deletion | XX | 7.71 | Unknown | Delayed cranial suture closure, high palate, intellectual disability, narrow forehead, Nystagmus, optic disc hypoplasia, preauricular pit | 1 |
| DECIPHER 263393 | 5:92082491-105391153 | Deletion | XY | 13.31 | De novo constitutive | Abnormality of the forehead, cryptorchidism, high palate, hypertelorism, hypoplasia of the corpus callosum, intellectual disability, leukodystrophy, low-set ears, micrognathia, muscular hypotonia, wide nasal bridge | 2 |
| DECIPHER 359588 | 5:94927116-101916299 | Deletion | XX | 6.99 | Maternally inherited, constitutive in mother | Astigmatism, global developmental delay, high palate, intellectual disability, borderline, myopia, Pes planus, poor motor coordination | 1 |
| DECIPHER 381223 | 5:98146325-98940120 | Duplication | XY | 0.794 | Unknown | Cleft palate | 1 |
The absence of nonclinically significant variants of CHD1 supports the hypothesis that CHD1 is important for early development. In addition, individuals harboring variants within or overlapping CHD1 display a spectrum of craniofacial abnormalities, suggesting a plausible role for CHD1 in face morphogenesis. However, due to the fact all CNVs encompassing CHD1 to-date include neighboring genes, the possibility that the disruption of these genes leads to facial anomalies cannot be ruled out. Therefore, we elected to model loss of Chd1 in Xenopus laevis and assess its putative role as a gene involved in craniofacial development.
3.2 |. chd1 is expressed in the developing craniofacial region of Xenopus laevis
The first piece of evidence to support a prospective role for Chd1 in craniofacial development is its expression during craniofacial development. First, RT-PCR revealed that chd1 transcripts were present throughout early stages of development including important stages of face formation (Figure S1). RNA-seq and Mass Spec analyses, available on the Xenopus community online database (Xenbase.org, [Bowes et al., 2008]), also indicated that chd1 mRNA and protein are present throughout early development. These data shows that the highest chd1.S and chd1.L mRNA levels are at the blastula and gastrula stages and then the relative levels of transcripts steadily decrease as development proceeds. On the other hand, protein levels of both Chd1.L and Chd1.S remain relatively high throughout early craniofacial development. These data also shows that chd1.L and chd1.S mRNA and protein levels are expressed at similar levels throughout craniofacial development.
To gain a more precise view of where Chd1 is important during craniofacial development we used in situ hybridization (Figure 2a–r). At stage 24–25 (26–29.5 hpf), chd1 was expressed in the presumptive eye and throughout the head (Figure 2a,b, arrow). At stage 29–30 (35–37.5 hpf), chd1 was expressed in the developing eye, brain, otic vesicle, and in the branchial arches (Figure 2c,d) consistent with previous reports (Linder, Cabot, Schwickert, & Rupp, 2004). Sectioning the anterior most region of the head revealed a clearer staining pattern and enrichment in the brain ventricle, within the developing lens, the mesenchyme of the 1st branchial arch and surrounding the embryonic mouth or stomodeum (Figure 2m–o). By stage 34–35 (44.5–53.5 hpf) chd1 was also localized in the presumptive heart (Figure 2e,f). There also appeared to be expression in the dorsal tail fin at this time but a similar staining pattern was also observed in the respective sense controls suggesting it could be nonspecific (Figure 2k, arrow). At stage 40–41 (66–76 hpf), chd1 was expressed throughout the head mesenchyme with enrichment around the eye and brain (Figure 2g,h). Sections through the anterior head at this stage confirmed the pattern and displayed greater clarity and detail (Figure 2p–r). For example, in the eye enrichment appeared in the retinal pigmented layer and what appear to be the plexiform layers (Figure 2r). Further, in such sections we observed enrichment of chd1 in the roof of the oral cavity.
FIGURE 2.

In situ hybridization of chd1 in X. laevis. (a,b) Stage 24–25, showing enrichment of chd1 throughout the head and eye. The black arrow indicates labeling in the head. (c,d) Stage 29–30 showing enrichment of chd1 in the eye, brain, otic vesicle, and branchial arches. (e,f) Stage 34–35 showing enrichment of chd1 in the eye, head, and presumptive heart. (g,h) Lateral and frontal view at stage 40–41 showing chd1 expressed in throughout the head with enrichment around the eye and brain. (i–l). Embryo hybridized with a sense probe. M) The head of an embryo at stage 29–30 showing the locations of sections in n and o. (n,o) Sections through the anterior head. (p) The head of an embryo at stage 40–41 showing the locations of sections in Q and R. ba, branchial arch; br, brain; cg, cement gland; no, nostril; ov, otic vesicleoc = oral cavity; st, stomodeum
Together, these results demonstrate that indeed chd1 is expressed in the many craniofacial structures at multiple stages of development.
3.3 |. Decreased Chd1 results in developmental defects in Xenopus laevis
To investigate the role of Chd1 in the orofacial development we utilized both titratable antisense oligos (MOs, and mosaic Crispr/Cas9 mutagenesis in F0 Xenopus embryos. Both of these methods can decrease the levels of Chd1 without eliminating the protein, avoiding lethality and severe defects expected in complete knockouts.
3.3.1 |. Validation of Chd1 knockdown assays
To mimic the loss of a heterozygous deletion, we created a Chd1 antisense MO that targeted one alloallele of chd1 (chd1.S) in Xenopus laevis. Chd1.SMO1 targeted the splice donor site at the exon 2—intron 2 boundary of chd1.S (but not chd1.L). We predicted that the Chd1.SMO1 would result in a splicing defect that would lead to the deletion of exon 2 of chd1.S (Figure 3a). To confirm this prediction RT-PCR was performed using primers that bind to exons 1 and 3 of chd1.S (but not chd1.L) (Figure 3a). RNA was extracted from embryos injected with approximately 65 ng of Chd1.SMO1 (or an equal amount of a standard control morpholino [CMO]). A PCR product of 339 base pairs in the CMO injected embryos indicated that exon 2 of chd1.S was still present (Figure 3a,b). In the Chd1.SMO1 morphants, a PCR product of 152 base pairs was produced consistent with the predicted exon 2 deletion in chd1.S (Figure 3a,b).
FIGURE 3.
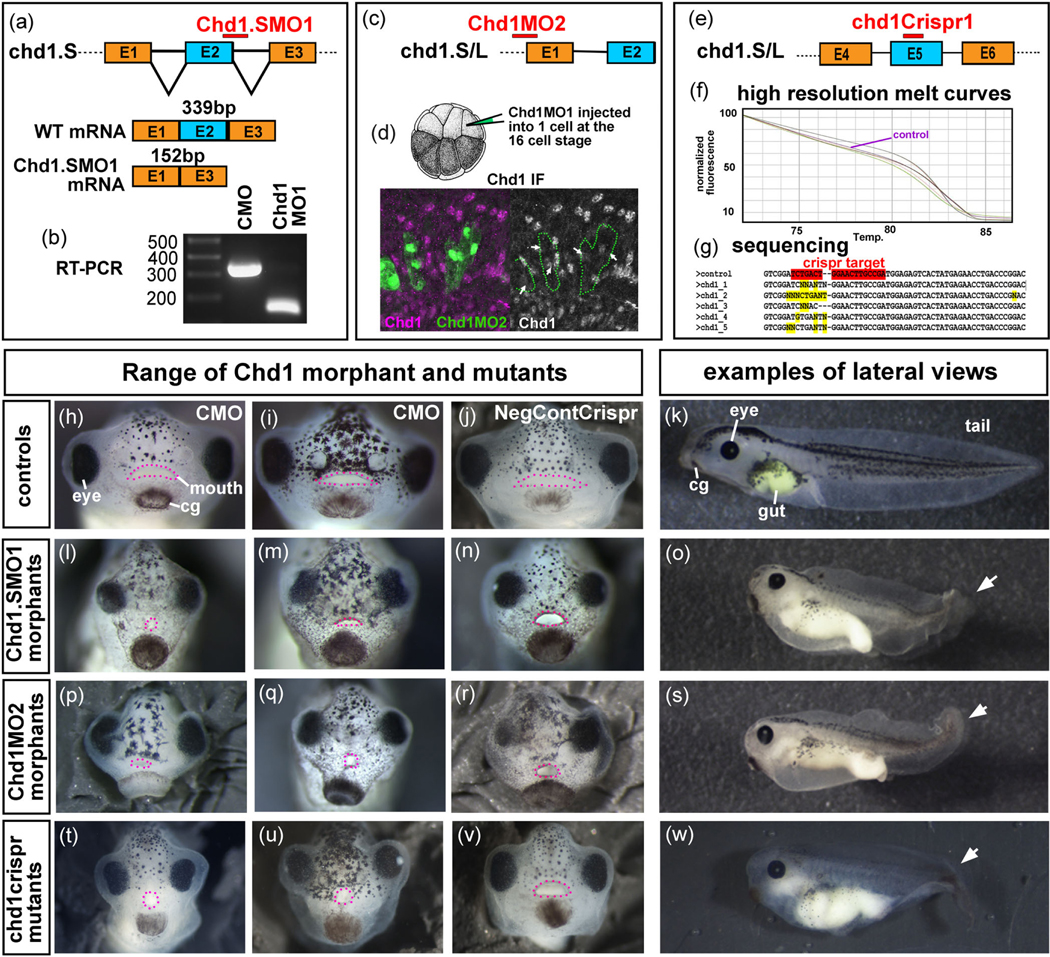
Knockdown of Chd1 in the embryo. (a) Schematic that shows the predicted binding target of Chd1.SMO1 morpholinos (red bar) and the expected spliced products of control (wild type) and morphant chd1.S mRNA. (b) RT-PCR indicates that the chd1 mRNA sequence between primers targeting exon 1 and 3 is smaller in Chd1.SMO1 morphants compared to control (CMO) embryos. (c) Schematic that shows the predicted binding target of Chd1.MO2 (red bar) to chd1.L and chd1.S mRNA. (d) Schematic that shows a 16-cell stage embryo injected into a dorsally fated blastomere creating mosaic knockdown. Representative image where fluorescently labeled Chd1.MO2 (green) cells have reduced Chd1 protein (pink). (e) Schematic that shows the target of the chd1Crispr sgRNA (red bar) in chd1.L and chd1.S genes. (f) High resolution melt curves that show different melt profiles in Chd1Crispr embryos with a phenotype compared to a control (purple) indicating possible mutations Sequences of DNA from control and mutant embryos using primers that bind to sequences flanking the predicted sgRNA binding site. Crispr target sequence is highlighted in red and changes in gene sequence is highlighted in yellow. (h–k). Frontal and lateral views of control embryos. For the lateral views, anterior is to the left. (l–o) Frontal and lateral views of Chd1.SMO1 morphants. (p–s) Frontal and lateral views of Chd1.MO2 morphants. (t–w) Frontal and lateral views of Chd1Crispr mutants. Pink dots outline the mouth. White arrows indicate tail defect. cg, cement gland
To ensure that S and L copies of chd1 did not have dramatically different functions and to show the specificity of Chd1.SMO1 we alternatively injected another MO that targeted the translation start site of both chd1.S and chd1.L (Chd1MO2; Figure 3c). To determine the effectiveness of Chd1MO2 we used immunofluorescence with an antibody created against a conserved region of the human Chd1 protein predicted to bind to both Xenopus chd1.S and chd1.L. Fluorescently tagged Chd1MO2 (1–5 ng) was injected in one dorsally fated cell at the 16 cell stage (Figure 3d). This effectively created mosaic embryos where MO containing cells could be directly compared to normal cells side by side in the same embryo. Results indicated that cells containing the Chd1MO2 had decreased levels of Chd1 protein (Figure 3d). It is important to note that Chd1 protein was not completely eliminated in all cells. Chd1.SMO1 also resulted in a decrease in Chd1 in some cells when injected in the same way (not shown).
To validate the specificity of Chd1 for craniofacial development using an alternate knockdown method we employed Crispr/Cas9 mosaic mutagenesis. Then, 200 pg of chd1Crispr gRNA, that targeted both chd1.L and chd1.S (Figure 3e), or a negative control sgRNA were each injected with 2 ng of Cas9 protein at the one-cell stage. A subset of the embryos were utilized for sequencing and high resolution melting (HRM) to confirm the Crispr/Cas9 induced mutation. Primers that targeted a 150 bp region surrounding the predicted mutation of both chd1.L and chd1.S were used for both HRM and sequencing. HRM revealed that indeed embryos with phenotypes had different melt profiles indicating the possibility of an induced mutation (Figure 3f). Further, sequencing the PCR products showed changes in the sequences at the sgRNA target (n = 10, 2 biological replicates, Figure 3g). A positive control was included in our analysis where we used sgRNA targeting slc45a2, a gene required for pigmentation (DeLay et al., 2018). Injections of slc45a2 gRNA (200 pg) and Cas9 protein (2 ng) resulted in a decrease in pigmentation as expected in 59% of the embryos (Figure S2, n = 80, 2 expts). Sequencing and HRM analysis of a subset of these affected embryos also confirmed the presence of a mutation at or near the sgRNA targeting site (Figure S2).
3.3.2 |. Chd1 MOs and Crisprs result in developmental abnormalities including craniofacial defects
To determine the developmental effects of decreased Chd1, the Chd1.SMO1 was first injected at a range of concentrations to determine an effective but nonlethal dose. Embryos injected with 15–25 ng of Chd1.SMO1 developed normally while those injected with 30–40 ng of Chd1.SMO1 had a mild reduction in the size (not shown). Embryos injected with 60–70 ng of Chd1.SMO1 displayed more profound defects (Figure 3l–o) but those injected with more than this died after gastrulation (not shown). 92% of the Chd1.SMO1 morphants injected with 60–70 ng/embryo were smaller and had defects in the tail, heart, gut, and craniofacial region by st. 42–43 (n = 2 experiments, 100 embryos, Figure 3h–o). In particular, the craniofacial defects included closer set and smaller eyes as well as malformed mouth shapes (Figure 3l–n). No defects were observed in the control MO injected embryos (n = 2 expts and 100 embryos).
Chd1MO2 was also injected at a range of concentrations and we determined that this MO caused lethality above 50 ng/embryo, consistent with the prediction that this MO would target both chd1.L and chd1.S. When this MO was titrated so that embryos received 30–40 ng, 75% of the tadpoles closely resembled the defects observed in the Chd1.SMO1 morphants (Figure 3p–s, n = 100 embryos, 2 expts).
chd1crispr gRNA and Cas9 protein injections resulted in 44% of the tadpoles with defects (n = 160, 3 experiments). Of these, 12% had very severe defects and died soon after gastrulation, potentially consistent with a high level of knockdown of Chd1 (not shown). However, 32% of the chd1crispr tadpoles appeared very similar to the Chd1 morphants, albeit with a wider range of severity (Figure 3t–w, n = 160, 3 expts). The same structures, that is the tail, heart, gut, and head were affected in these mutants. Importantly, these tadpoles also had defects in the craniofacial region that were remarkably similar to the Chd1 morphants. Such defects included a narrower midface and smaller mouth (Figure 3t–v). No abnormalities were noted in the negative control injected embryos (n = 100, 2 expts).
The MO and Crispr mutagenesis knockdown experiments targeting either chd1.S or both chd1.S and chd1.L all resulted in very similar phenotypes suggesting specificity of the methods. Further, these results show that indeed Chd1 is required for craniofacial development.
3.3.3 |. Chd1.SMO1 morphants have a smaller size and altered face shape that is specific to decreased Chd1 in the face
To better understand the effects of Chd1 on craniofacial development we next concentrated on characterizing the facial phenotypes of embryos injected with Chd1.S MO1 since (a) it was the most consistent tool, causing the least variation in defects especially compared to the chd1crispr and (b) was easier to work with since it solubilized better than Chd1MO2.
3.3.4 |. Quantification of face size and shape indicates Chd1 morphants have a smaller face
First, the face sizes and shapes were quantified in a subset of Chd1. SMO1 morphants. The intercanthal distance (distance between the eyes) was significantly decreased by 2.11 fold in Chd1.SMO1 morphants when compared to controls (n = 33, three biological replicates, p < .0001 T-test, Figure 4(a),(b)). The mouth width of Chd1. SMO1 morphants was decreased by 4.59 fold when compared to the controls (n = 33, three biological replicates, p < .0001, T-test, Figure 4a,c). These results demonstrate that the faces are indeed narrower and the mouth is smaller in Chd1 morphants compared to controls (injected with control morpholino [CMO]).
FIGURE 4.

Quantifying face malformations in Chd1MO1 morphants. (a) Schematic indicating intercanthal distance and mouth width. (b,c) Box and whisker plots to visualize the difference in intercanthal distance and mouth width in Chd1.SMO1 morphants and controls (CMO). (d) Schematic that shows the positions of the landmarks utilized for morphometric analysis. (e) Transformation grid that shows the changes in landmark positions between Chd1.SMO1 morphants compared to control embryos (Procrustes distance 0.1378, p-value <.0001). The blue arrows indicate prominent narrowing in the midface between the eyes. (f) Principle component analysis of landmark coordinates showing statistical differences between control and Chd1.SMO1 morphant embryos, p-value <.0001. (g) Schematic of morphant face transplants. (h–k) Frontal views of embryos that received either control MO or Chd1.SMO1 morphant tissue. The green overlay in i and k show the location of morpholino containing tissue. The mouth is outlined in pink dots. (l) Box and whisker plot summarizing measurements of the mouth width of embryos that received face transplants
Of note, the faces of the Chd1.SMO1 morphants were not simply just smaller but also a different shape. This was evident in the fact that the mouth widths and intercanthal distances were not decreased by the same amount (2.11 vs. 4.59 fold). To further quantify such face shape changes we utilized geometric morphometrics which eliminates differences due to face size by aligning landmarks. Twenty-seven landmarks were used to represent the shape of the face in this study (Figure 4d). First a discriminant function analysis was used to visualize the changes in landmark location using vectors superimposed on a transformation grid. Results showed that the landmarks were shifted in the morphants in such a way that is consistent with a narrowing of the face with respect to height (Figure 4e). In particular, the warping of the grid indicated such narrowing was most prominent in the midface area between the eyes (Figure 4e, blue arrows). PCA demonstrated graphically the statistical differences between the landmarks of controls (CMO) and Chd1.SMO1 morphants (Procrustes distance = 0.1378, p-value <.0001, Figure 4f).
These results demonstrate that Chd1.SMO1 morphants do indeed have a quantifiable difference in the size and shape of their faces compared to controls.
3.3.5 |. Chd1.SMO1 face transplants indicate mouth size is specific to decreased Chd1 in the face
It is possible that decreasing Chd1 in other regions of the embryo nonspecifically affects orofacial development. For example, chd1 is expressed in the brain and eyes and therefore loss of function in these tissues may indirectly affect the size and shape of the face (Marcucio, Hallgrimsson, & Young, 2015). To test for a specific role for Chd1 in the formation of the orofacial tissues we used a transplant analysis. The presumptive mouth and surrounding tissues from a donor Chd1.SMO1 morphant (or control morphant) were transplanted to an uninjected sibling embryo (Figure 4g). These transplants were performed at stage 25–26 and contained all tissues present in the face at that time. Measurements revealed that the mouth width was statistically decreased by 1.7 fold in the embryos with morphant tissue compared to embryos with control, wildtype tissue (n = 10, 2 experiments, p < .0001, T-test, Figure 4h–l). These results indicate that indeed Chd1 is required specifically in the developing face.
3.4 |. Chd 1 morphants have reduced head cartilage and decreased cranial neural crest gene expression
3.4.1 |. Decreased Chd1 results in defects in craniofacial cartilage development
The craniofacial cartilage helps to provide the underlying structure and shape of the face. Therefore, we predicted that defects in the development of these cartilages could explain the changes in facial size and shape of Chd1.SMO1 morphants. After injections of Chd1.
SMO1, head cartilages were visualized with Alcian blue staining at stage 45–46 (hpf) (Figure 5a). We observed a clear reduction in the craniofacial cartilages in the Chd1.SMO1 morphants when compared to controls (Figure 5b–e). In addition, the ethmoid cartilage that forms the roof of the oral cavity in nonamniotes was missing in 100% of the Chd1.SMO1 morphants examined (n = 30, two biological replicates, Figure 5c–e, blue arrow). The changes in the cartilages were consistent with the narrowing of the head, especially in the midface where the ethmoid cartilage is located.
FIGURE 5.

Chd1 is required for cranial cartilages and neural crest development. (a) Schematic of the experimental design for b–e. (b–e) Alcian blue labeling of cartilage in Control and Chd1.SMO1 morphant embryos (stage 45–46). Blue arrow indicates the missing ethmoid cartilage in Chd1.SMO1 morphants. (f) Schematic of the experimental design for tfap-2α in situ hybridization experiments, where one cell was injected at the 2-cell stage in g–j. (g–h) Lateral views of Control MO or Chd1.SMO1 injected sides of embryos labeled with tfap-2α probe (st. 24–25). Blue arrows indicate branchial neural crest streams. (i,j) Dorsal and frontal views of Chd1.SMO1 injected embryos labeled with tfap-2α (st. 24–25). Black arrowhead indicates the Chd1.SMO1 injected side. Yellow arrow indicates the mandibular neural crest stream. (k) Schematic of the experimental design for qRT-PCR experiment in l. (l) Relative expression of tfap-2α by qRT-PCR. Asterisk indicates statistical significance. Bh, Basihyal; cg, cement gland; Ch, ceratohyal; Eth, Ethmoid; Mk, Meckel’s; Pq, palatoquadrate
3.4.2 |. The expression of neural crest gene, tfap-2α, is depressed in Chd1 morphants
Since the craniofacial cartilages are derived from cranial neural crest and chd1 appeared to be expressed in regions where the cranial neural crest and its derivatives are located, we hypothesized that Chd1 was required for neural crest development. Therefore, we next examined cranial neural crest development in Chd1.SMO1 morphants by in situ hybridization and qRT-PCR. First, we injected fluorescein labeled Chd1.SMO1 into one cell at the two cell stage to create “half morphants” (Figure 5f). In these embryos, the “normal side” of the embryo was compared to a “Chd1.SMO1 morphant side” at a time when neural crest has migrated into the head (st. 24–25; Figure 5f). In situ hybridization with the neural crest marker tfap-2α indicated that 100% of the “morphant sides” had abnormal expression of this marker gene (n = 30, Figure 5g–j). Specifically, the anterior-most (mandibular and hyoid) streams of cranial neural crest were not as distinctly separated and the posterior branchial streams were not labeled with tfap-2α as distinctly ((compare blue arrows Figure 5g,h). Further, the neural crest that occupied the region surrounding the presumptive embryonic mouth was also fainter (Figure 5j, yellow arrow). To quantify these latter observations, we also performed qRT-PCR with primers directed to tfap-2α . Embryos were injected with Chd1.SMO1 or standard control MO at the one-cell stage followed by head microdissections (n = 30 embryos, three replicates, Figure 5k). Results showed that relative expression of tfap-2α was reduced by approximately 50% in the Chd1.SMO1 morphants when normalized with gapdh (p = .05, Mann–Whitney U tests; Figure 5l). These results confirm our observations that tfap-2α is reduced in Chd1 morphants.
Together our investigation of neural crest development indicates that the neural crest was specified and could migrate in the Chd1. SMO1 morphants. However, there was a clear decrease in neural crest gene expression and migration streams were less well defined which could explain the defects in the cranial cartilages.
3.5 |. Decreased Chd1 results in excessive apoptosis in the head during craniofacial development
A reduction in neural crest gene expression could be a consequence of decreased neural crest cells by either reduced cell proliferation and/or increased cell death. To assess the levels of these processes we first performed flow cytometry. Microdissected cranial tissues were collected from Chd1.SMO1 morphants and controls at stage 29–30 (35–37.5 hpf) (n = 100 dissections, two replicates). The cells were dissociated, fixed, labeled with propidium iodide and analyzed by flow cytometry (Figure 6a). Results indicated that embryos with decreased Chd1 had only a minor decrease in the percentage of cells in the G0/G1, S, and G2/M phases of the cell cycle (Figure 6b–e). However, Chd1.SMO1 morphants had a larger proportion of cells in the sub-G1 fraction (blue arrows, Figure 6c,e), which contains fragmented DNA indicative of cells undergoing apoptosis. These results are suggestive of an increase in apoptosis in the cranial tissues of Chd1.SMO1 morphants. To validate this result, immunohistochemistry was utilized to detect a marker of apoptosis, cleaved caspase-3. Results indicated that there was a dramatic increase in cleaved caspase-3 in the head and tail of Chd1.SMO1 morphants compared to control embryos (Figure 6f–I, arrows). Such enrichment is consistent with the smaller size of the embryos and defects in the craniofacial region and tail.
FIGURE 6.

Decreased Chd1 results in increased apoptosis. (a) Schematic of the experimental design for flow cytometry and cleaved caspase 3 immunohistochemistry. (b,c) Average percentages of cells in each phase of the cell cycle. Blue arrow emphasizes the increase in the SubG1 phase. (d,e) Representative cell cycle profiles. Blue arrow emphasizes the increase in the SubG1 phase (f–i) Control or Chd1.SMO1 morphant embryos (stage 29–30) labeled with cleaved caspase-3. Purple arrows indicate increased cleaved caspase-3 immunohistochemistry in the eye head (i) and tail (i). cg, cement gland
Together, flow cytometry and immunohistochemistry indicate that Chd1.SMO1 morphants have increased apoptosis in the developing head which could help to explain the craniofacial defects.
3.6 |. Retinoic acid regulates chd1 during orofacial development
3.6.1 |. Perturbing retinoic acid signals in the face results in altered levels of chd1 mRNA
In our previous work, chd1 mRNA was decreased in craniofacial tissues deficient in retinoic acid receptor function (Wahl et al., 2018). Therefore, we hypothesized that retinoic acid signaling regulates chd1 expression. chd1 mRNA levels were analyzed in microdissected cranial tissues after exposure to either a RAR antagonist or agonist using qRT-PCR. At stage 23–24, embryos were exposed to 1 μM of BMS-543 (RAR antagonist) overnight at 15C (Figure 7a). Alternatively, embryos were treated with TTNBP (RAR agonist) for 4 hr at 23C (Figure 7a). To ensure that these treatments were effective a subset of embryos were raised until stage 43–45. Indeed we observed that embryos exposed to either treatment had narrower faces, eye defects and abnormal mouth shapes as described previously (Kennedy & Dickinson, 2012, 2014b; Vieux-Rochas et al., 2010) (not shown). After treatments, RNA was extracted from head tissues and qRT-PCR performed (Figure 7a). Results indicated that RAR antagonist resulted in 0.58 fold decrease in chd1 mRNA levels while the retinoic acid agonist resulted in a 2.1 fold increase in chd1 mRNA levels when normalized against actin (n = 30, 2 experiments for each; p = .05, Mann–Whitney U test; Figure 7b). These results suggest that chd1 levels are under the influence of retinoic acid signals.
FIGURE 7.

Retinoic acid regulates chd1 during orofacial development. (a) Schematic of the experimental design for RT-PCR experiments to measure relative chd1 levels. (b) Relative chd1 expression levels (normalized to actin) following exposure to a RAR antagonist or RAR agonist compared to controls (c). Asterisks designate statistical significance. (c) Schematic of the experimental design for RAR antagonist and CHD1.SMO1 synergy experiments. (d–g) Frontal views of embryos exposed to Control MO (d), sub-phenotypic concentration of RAR inhibitor (e), sub-phenotypic concentration of CHD1.SMO1 (f) and combination of sub-phenotypic concentrations of RAR inhibitor and CHD1.SMO1 (g). Pink dots outline the mouth. (e) Schematic of the chd1.S and chd1.L homeologs indicating the location of putative retinoic acid response elements (RAREs)
3.6.2 |. Sub-phenotypic levels of RAR antagonist and Chd1.SMO1 synergize to cause a craniofacial defect
If retinoic acid signaling regulates chd1 expression then we would predict that a small depression in both RAR function and Chd1 levels would synergize, resulting in a defective craniofacial phenotype. To test this hypothesis, sub-phenotypic doses of RAR antagonist (0.1 nM) and Chd1 MOs (10 ng/embryo) were utilized. Controls were embryos that were injected with low MO alone or treated with a low concentration of RAR inhibitor alone. These controls displayed no detectable phenotype (Figure 7c–g). However, when the low levels of inhibitor and Chd1 were combined, a phenotype was observed in 77% of the embryos (n = 30 for each condition, three experiments, Figure 7c–g). These results suggest a possible interaction between retinoic acid and Chd1.
3.6.3 |. Retinoic acid receptor elements (RAREs) are present in putative regulatory regions of chd1 in Xenopus, humans, and other vertebrates
One possible method by which retinoic acid signals could regulate chd1 expression is directly by promoting its transcription. RAR receptors bind to retinoic acid receptor elements (RAREs) in regions surrounding the open reading frames of the genes they regulate. A RARE consensus sequence consists of 5′-RGKTCA-(n)1,2,5-RGKTCA-3′ (Lalevee et al., 2011) which can occur with several spacing variations (1, 2, 5) in locations as far as 20 kb upstream of the transcriptional start site, within the gene itself or in the 3′ region (Moutier et al., 2012). Therefore, we analyzed these putative regulatory regions of the X. laevis chd1.S and chd1.L. Results revealed three putative RARE sites in chd1.S: two upstream of the transcriptional start site and another located within the gene. In chd1.L there were two inverted RARE sites; one upstream of the transcriptional start site and another also within gene (Figure 7e). To determine how prevalent RARE sites are within chd1 of vertebrates we searched the same region of organisms representing mammals, birds, amphibians, and fish. The number of RARE sites ranged from 11 to 2 with humans having the most and chickens the least (Figure S3). Together, these results suggest the possibility that retinoic acid signals could directly regulate chd1 transcription and this regulation could be conserved across vertebrates. Future chromatin immunoprecipitation assays, reporter assays and promoter mutagenesis studies would be required to validate such findings.
3.6.4 |. Embryos with deceased retinoic acid signaling have similar craniofacial phenotypes as Chd1 morphants and RARg is expressed in a similar region as chd1
To provide further support that RA signals regulate chd1, we reexamined data generated from previous studies in the lab (Kennedy & Dickinson, 2012, 2014a, 2014b). Our image database of embryos injected with a MO targeting RALDH2 (30–60 ng) revealed that 30% of these embryos highly resembled Chd1 morphants (n = 90, three replicates). Further, 35% of embryos treated with a RAR antagonist (1 μM, BMS453, st. 2–43) also resembled Chd1 morphants (n = 60, three replicates). Common phenotypes to all three groups included a small malformed-shaped mouth, narrower face and eye defects which included the lens protrusion (Figure S4a–f).
In addition, we also compared chd1 expression with our previous images of RARg expression (Kennedy & Dickinson, 2012). At stage 27–30 expression appeared in the same region of the anterior head, ventral to the brain and lateral to the stomodeum (Figure S4g,h). At a later stage both chd1 and RARg are expressed in tissues consistent with head mesenchyme surrounding the brain, eyes and nostrils (- Figure S4i,j).
Together these results lend further support that Chd1 requires retinoic acid signaling in the developing embryo.
4 |. DISCUSSION
In the present work we have used the aquatic developmental model, Xenopus laevis, to uncover potential causes of craniofacial dysmorphia in a rare group of human birth defects that result from reduction in dosage of CHD1.
4.1 |. Variants of CHD1 cause craniofacial birth defects that can be modeled in Xenopus
Loss of function of both CHD1 alleles has not been observed in humans and mouse homozygous knockouts of Chd1 die very early in development (Guzman-Ayala et al., 2015). However, several patients carrying CNVs that alter CHD1 gene dosage have been identified and these individuals exhibit intellectual disorders and craniofacial defects which collectively are now called PILBOS (OMIM 617682). The facial abnormalities include depressed midface, narrow forehead, anteriorly-facing nostrils, micrognathia, pointed chin, reduction in the ethmoid sinuses and a cleft or high palate and/or cleft lip ([DeMyer, 1967; Pilarowski et al., 2017] and see Table 1). The only available heterozygous (Chd1+/−) mice are normal, and embryonic studies or conditional knockouts are still needed to model the human syndrome. Therefore, we have created a Xenopus model to study the role of Chd1 in craniofacial development. When Chd1 is decreased in this organism we observed many craniofacial defects that are analogous to those in humans, including a depressed and narrower midface, micrognathia and ethmoid cartilage defects. Further, using transplant analysis we have shown that Chd1 is specifically required in the orofacial tissues and therefore craniofacial anomalies are not secondary to other malformations. Thus, Xenopus can serve as an effective and unique tool to understand the mechanisms by which CHD1 regulates craniofacial development.
4.2 |. Chd1 is modulated by an important craniofacial regulator: Retinoic acid
Craniofacial development is orchestrated by a complex network of signals, transcription factors, and epigenetic regulators. Therefore, we were interested in understanding how Chd1 fits into the developmental networks that regulate orofacial formation. In previous work and here in this study we provide evidence that retinoic acid signals regulate chd1 in craniofacial development (Wahl et al., 2018). Specifically, RAR agonist treatment increased chd1 expression while an antagonist had the opposite effect. Further, we determined that RAR inhibition and Chd1 deficiency synergize to cause craniofacial defects and plausibly interact. Previous work in the Dickinson lab also indicated that RA deficiency can produce embryos with similar craniofacial abnormalities and RARg expression is remarkably similar to that of chd1 in the developing head (see Figure S4). Another piece of evidence comes from a bioinformatic analysis of retinoic acid receptor binding sequences. Retinoic acid binds to heterodimers of the nuclear receptors of RARs and RXRs that in turn bind to retinoic acid response elements (RAREs) in the regulatory regions of retinoic acid target genes. We uncovered candidate RARE sites in putative regulatory regions of the chd1 gene in Xenopus. Similar RAREs were also identified near the chd1 genes of all other vertebrates examined (Figure S3). While this analysis is suggestive, RAR binding and regulation of targets are complex. Delacroix and colleagues (Delacroix et al., 2010) elegantly showed that RAR’s can bind to sites other than canonical consensus RARE sites. Further, RAR binding to a RARE site of a target gene does not necessarily result in changes in expression of that gene upon retinoic acid application. Thus, future work will be critical to confirm whether these putative RAREs in chd1 regulatory regions actually bind RARs and if such binding can alter chd1 expression.
Retinoic acid signals are critical for numerous events in craniofacial development, from neural crest development, specification of the pharyngeal arches, primary palate development and jaw cartilage formation (Brickell & Thorogood, 1997; Dubey, Rose, Jones, & Saint-Jeannet, 2018; Duester, 2008; Kumar, Sandell, Trainor, Koentgen, & Duester, 2012; Mark et al., 1995; Mark et al., 2004; Sandell et al., 2007; Shimomura et al., 2015). Hence, many of the craniofacial malformations that are attributed to CHD1 deficiency may be due to the inability to perpetuate retinoic acid signals during craniofacial development. Indeed humans with CNVs affecting retinoic acid receptors or RALDH2 share many of the same craniofacial malformations observed in patients with PILBOS (Table S2).
Retinoic acid signals are required for the expression of other similar types of transcriptional regulators during craniofacial development. For example, retinioic acid also regulates the chromatin modulator, RAI1, during neural and craniofacial development in humans and Xenopus (Tahir, Kennedy, Elsea, & Dickinson, 2014). Further, transcriptional profiling of craniofacial tissues deficient in RA signals identified several other proteins that can modify chromatin and DNA (Wahl et al., 2018). A better understanding of the coordination of retinoic acid gradients with chromatin and DNA regulators will provide a more complete view of how this important signal is required during the development of the face.
4.3 |. Chd1 is integral for neural crest development
Chd1 deficient Xenopus embryos did not form distinct cranial neural crest migratory streams and jaw cartilage, a neural crest derivative, was reduced. These results suggest that there is a requirement for Chd1 in neural crest migration and differentiation in Xenopus embryos. Neural crest cells originate at the interface between ectoderm and anterior neural plate (Groves & LaBonne, 2014) and then migrate into the head to become an integral part of the facial prominences. Cranial neural crest cells go on to differentiate into various orofacial tissues such as cartilage, bone, peripheral nerves, and connective tissues (reviewed in [Betancur, Bronner-Fraser, & Sauka-Spengler, 2010; Bronner & LeDouarin, 2012; Cordero et al., 2011; Mayor & Theveneau, 2013; Milet & Monsoro-Burq, 2012; Minoux & Rijli, 2010; Sauka-Spengler & Bronner-Fraser, 2008]). In addition, neural crest cells have inductive roles in the development of other cranial tissues, such as the blood vessels, muscle and skin (Rinon et al., 2007; Simoes-Costa & Bronner, 2015). Therefore, craniofacial development is very much dependent upon successful migration and differentiation of the neural crest.
Expression of chd1 was observed throughout the developing head rather than specifically in only neural crest cells themselves. Therefore, chd1 could be required directly in the neural crest and/or in the environment in which the neural crest develops. Regardless we could hypothesize that one role for Chd1 in neural crest development is to modulate transcription of cranial neural crest regulators, directly or more indirectly. We found that the neural crest regulator, tfap-2α, was decreased in embryos deficient in Chd1. Tfap-2α is a transcription factor that is critical for both specification and migration of neural crest across vertebrates (Mitchell, Timmons, Hebert, Rigby, & Tjian, 1991; Sauka-Spengler & Bronner-Fraser, 2008; Winning, Shea, Marcus, & Sargent, 1991). Consistently, a reduction in tfap-2 can cause craniofacial abnormalities in Xenopus and mice that mirror what we have observed in Chd1 morphant embryos (Mitchell et al., 1991; Winning et al., 1991). Certainly, other epigenetic modulators can regulate the expression of genes required for cranial neural crest development reviewed in (Hatch et al., 2016; Macri et al., 2016; Rogers & Nie, 2018; Strobl-Mazzulla, Sauka-Spengler, & Bronner-Fraser, 2010). For example, another chromodomain family member, Chd7 and its binding partner Pbaf, have been shown to regulate sox9 and twist in neural crest specification(Bajpai et al., 2010; Sperry et al., 2014; Zentner et al., 2010). In summary, Chd1 could be required for craniofacial development by having a role in the transcriptional activation of neural crest regulators. Future work could define specifically which neural crest regulatory genes are misexpressed in the orofacial tissues of Chd1 deficient embryos. This would help to determine more definitively the steps in cranial neural crest development that this protein either directly or indirectly modulates.
4.4 |. Decreased Chd1 causes increased cell death in the developing head
Another possible mechanism by which Chd1 deficiency results in craniofacial defects is that this protein is critical for survival of cells in the developing head. In Xenopus craniofacial tissues lacking Chd1, we noted an increase in cell death by flow cytometry and immunohistochemistry. Consistent with our observations, Chd1−/− mice also have increased apoptotic cells (Guzman-Ayala et al., 2015). There are certainly many examples of where a deficiency in a gene important in craniofacial development can result in excess apoptosis in tissues contributing to the face (e.g., see [DiStasio, Paulding, Chaturvedi, & Stottmann, 2020; Dixon et al., 2006; Han et al., 2019; Lukacs, Roberts, Chatuverdi, & Stottmann, 2019; Sakai & Trainor, 2016]). Chd1’s requirement in cell survival could be indirect, a consequence of aberrant gene regulation or increased oxidative stress. It also could be required for cell survival more directly by modulating the apoptotic responses. Chd7, for example, can do this by suppressing an apoptosis factor, apoptosis signal-regulating kinase 1 (Ask1) to promote survival of cardiac neural crest cells (Li et al., 2013). Another way to modulate apoptosis is by mediating DNA damage response. Effective responses to DNA damage may be necessary for craniofacial development. This is evident in the mammalian cranial neural crest where there is an enrichment of DNA repair proteins (Albino et al., 2011). Also, perturbation of the DNA repair protein, BRAC1, induced DNA damage and apoptosis in mice resulting in craniofacial defects (Kitami, Kitami, Kaku, Wang, & Komatsu, 2018). Additionally, Chd1 itself is also known to be critical for DNA repair (Zhou et al., 2018) and the dysregulation of the DNA damage response by CHD1 misexpression is what promotes some forms of cancer (Kari et al., 2018; Mills, 2017). In summary, decreased Chd1 could result in craniofacial defects by being essential for survival of cells in the head.
In conclusion, we provide evidence that reduced Chd1 leads to craniofacial defects in an aquatic developmental model, Xenopus laevis. Such defects include a narrower midface, smaller jaw, and missing elements of the palate. These malformations are consistent with those observed in humans with heterozygous loss of CHD1. Moreover, using this model we are the first to uncover mechanisms by which such craniofacial malformations occur and how Chd1 is integrated into the complex regulation of face development. Future work could utilize this information to begin to develop methods to ameliorate defects that occur to the face in patients with deficient CHD1 function.
Supplementary Material
ACKNOWLEDGMENTS
We thank Deborah Howton for her help with animal care, photography and microdissections. In addition, we would like to thank Dr. Greg Walsh for his help with HRM and Crispr protocols. Services in support of the research project were provided by the VCU Massey Cancer Center Flow Cytometry Core, supported, in part, with funding from NIH-NCI Cancer Center Support Grant P30 CA016059. This study makes use of data generated by the DECIPHER community. A full list of centers who contributed to the generation of the data is available from https://decipher.sanger.ac.uk and via email from decipher@sanger.ac.uk. Funding for the project was provided by Wellcome.
Funding information
USA National Institutes of Health (NIH), Grant/Award Numbers: NIH T32 GM-008629, R01 DE-021071, R01 DE-023553; National Science Foundation, Grant/Award Number: IOS-1349668
Footnotes
SUPPORTING INFORMATION
Additional supporting information may be found online in the Supporting Information section at the end of this article.
CONFLICT OF INTEREST
No competing interests declared.
REFERENCES
- Albino D, Brizzolara A, Moretti S, Falugi C, Mirisola V, Scaruffi P, … Tonini GP (2011). Gene expression profiling identifies eleven DNA repair genes down-regulated during mouse neural crest cell migration. The International Journal of Developmental Biology, 55(1), 65–72. 10.1387/ijdb.092970da [DOI] [PubMed] [Google Scholar]
- Aramaki M, Kimura T, Udaka T, Kosaki R, Mitsuhashi T, Okada Y, … Kosaki K. (2007). Embryonic expression profile of chicken CHD7, the ortholog of the causative gene for CHARGE syndrome. Birth Defects Research. Part A, Clinical and Molecular Teratology, 79(1), 50–57. 10.1002/bdra.20330 [DOI] [PubMed] [Google Scholar]
- Bajpai R, Chen DA, Rada-Iglesias A, Zhang J, Xiong Y, Helms J, … Wysocka J. (2010). CHD7 cooperates with PBAF to control multipotent neural crest formation. Nature, 463(7283), 958–962. 10.1038/nature08733 [DOI] [PMC free article] [PubMed] [Google Scholar]
- Bernier R, Golzio C, Xiong B, Stessman HA, Coe BP, Penn O, … Eichler EE (2014). Disruptive CHD8 mutations define a subtype of autism early in development. Cell, 158(2), 263–276. 10.1016/j.cell.2014.06.017 [DOI] [PMC free article] [PubMed] [Google Scholar]
- Betancur P, Bronner-Fraser M, & Sauka-Spengler T. (2010). Assembling neural crest regulatory circuits into a gene regulatory network. Annual Review of Cell and Developmental Biology, 26, 581–603. 10.1146/annurev.cellbio.042308.113245 [DOI] [PMC free article] [PubMed] [Google Scholar]
- Bowes JB, Snyder KA, Segerdell E, Gibb R, Jarabek C, Noumen E, … Vize PD (2008). Xenbase: A Xenopus biology and genomics resource. Nucleic Acids Research, 36(Database issue), D761–D767. 10.1093/nar/gkm826. [DOI] [PMC free article] [PubMed] [Google Scholar]
- Brickell P, & Thorogood P. (1997). Retinoic acid and retinoic acid receptors in craniofacial development. Seminars in Cell & Developmental Biology, 8(4), 437–443. 10.1006/scdb.1997.0167 [DOI] [PubMed] [Google Scholar]
- Bronner ME, & LeDouarin NM (2012). Development and evolution of the neural crest: An overview. Developmental Biology, 366(1), 2–9. 10.1016/j.ydbio.2011.12.042 [DOI] [PMC free article] [PubMed] [Google Scholar]
- Cordero DR, Brugmann S, Chu Y, Bajpai R, Jame M, & Helms JA (2011). Cranial neural crest cells on the move: Their roles in craniofacial development. American Journal of Medical Genetics Part A, 155a(2), 270–279. 10.1002/ajmg.a.33702 [DOI] [PMC free article] [PubMed] [Google Scholar]
- Delacroix L, Moutier E, Altobelli G, Legras S, Poch O, Choukrallah MA, … Davidson I. (2010). Cell-specific interaction of retinoic acid receptors with target genes in mouse embryonic fibroblasts and embryonic stem cells. Molecular and Cellular Biology, 30(1), 231–244. 10.1128/mcb.00756-09 [DOI] [PMC free article] [PubMed] [Google Scholar]
- DeLay BD, Corkins ME, Hanania HL, Salanga M, Deng JM, Sudou N, … Miller RK (2018). Tissue-specific gene inactivation in Xenopus laevis: Knockout of lhx1 in the kidney with CRISPR/Cas9. Genetics, 208(2), 673–686. 10.1534/genetics.117.300468 [DOI] [PMC free article] [PubMed] [Google Scholar]
- DeMyer W. (1967). The median cleft face syndrome. Differential diagnosis of cranium bifidum occultum, hypertelorism, and median cleft nose, lip, and palate. Neurology, 17(10), 961–971. 10.1212/wnl.17.10.961 [DOI] [PubMed] [Google Scholar]
- Dickinson AJ (2016). Using frogs faces to dissect the mechanisms underlying human orofacial defects. Seminars in Cell & Developmental Biology, 51, 54–63. 10.1016/j.semcdb.2016.01.016 [DOI] [PMC free article] [PubMed] [Google Scholar]
- DiStasio A, Paulding D, Chaturvedi P, & Stottmann RW (2020). Nubp2 is required for cranial neural crest survival in the mouse. Developmental Biology, 458(2), 189–199. 10.1016/j.ydbio.2019.10.039 [DOI] [PMC free article] [PubMed] [Google Scholar]
- Dixon J, Jones NC, Sandell LL, Jayasinghe SM, Crane J, Rey JP, … Trainor PA (2006). Tcof1/treacle is required for neural crest cell formation and proliferation deficiencies that cause craniofacial abnormalities. Proceedings of the National Academy of Sciences of the United States of America, 103(36), 13403–13408. 10.1073/pnas.0603730103 [DOI] [PMC free article] [PubMed] [Google Scholar]
- Dubey A, Rose RE, Jones DR, & Saint-Jeannet JP (2018). Generating retinoic acid gradients by local degradation during craniofacial development: One cell’s cue is another cell’s poison. Genesis, 56(2), 79–92. 10.1002/dvg.23091 [DOI] [PMC free article] [PubMed] [Google Scholar]
- Duester G. (2008). Retinoic acid synthesis and signaling during early organogenesis. Cell, 134(6), 921–931. 10.1016/j.cell.2008.09.002. [DOI] [PMC free article] [PubMed] [Google Scholar]
- Dupe V, & Pellerin I. (2009). Retinoic acid receptors exhibit cell-autonomous functions in cranial neural crest cells. Developmental Dynamics, 238(10), 2701–2711. 10.1002/dvdy.22087 [DOI] [PubMed] [Google Scholar]
- Firth HV, Richards SM, Bevan AP, Clayton S, Corpas M, Rajan D, … Carter NP (2009). DECIPHER: Database of chromosomal imbalance and phenotype in humans using Ensembl resources. American Journal of Human Genetics, 84(4), 524–533. 10.1016/j.ajhg.2009.03.010 [DOI] [PMC free article] [PubMed] [Google Scholar]
- Francis-West PH, Robson L, & Evans DJR (2003). Craniofacial development: The tissue and molecular interactions that control development of the head. In Berlin. New York: Springer. [DOI] [PubMed] [Google Scholar]
- Gitton Y, Heude E, Vieux-Rochas M, Benouaiche L, Fontaine A, Sato T, … Levi G. (2010). Evolving maps in craniofacial development. Seminars in Cell & Developmental Biology, 21(3), 301–308 10.1016/j.semcdb.2010.01.008. [DOI] [PubMed] [Google Scholar]
- Glessner JT, Wang K, Cai G, Korvatska O, Kim CE, Wood S, … Hakonarson H. (2009). Autism genome-wide copy number variation reveals ubiquitin and neuronal genes. Nature, 459(7246), 569–573. 10.1038/nature07953 [DOI] [PMC free article] [PubMed] [Google Scholar]
- Greenway SC, Pereira AC, Lin JC, DePalma SR, Israel SJ, Mesquita SM, … Seidman CE (2009). De novo copy number variants identify new genes and loci in isolated sporadic tetralogy of Fallot. Nature Genetics, 41(8), 931–935. 10.1038/ng.415 [DOI] [PMC free article] [PubMed] [Google Scholar]
- Groves AK, & LaBonne C. (2014). Setting appropriate boundaries: Fate, patterning and competence at the neural plate border. Developmental Biology, 389(1), 2–12. 10.1016/j.ydbio.2013.11.027 [DOI] [PMC free article] [PubMed] [Google Scholar]
- Guzman-Ayala M, Sachs M, Koh FM, Onodera C, Bulut-Karslioglu A, Lin CJ, … Ramalho-Santos M. (2015). Chd1 is essential for the high transcriptional output and rapid growth of the mouse epiblast. Development, 142(1), 118–127. 10.1242/dev.114843 [DOI] [PMC free article] [PubMed] [Google Scholar]
- Hall JA, & Georgel PT (2007). CHD proteins: A diverse family with strong ties. Biochemistry and Cell Biology, 85(4), 463–476. 10.1139/o07-063 [DOI] [PubMed] [Google Scholar]
- Han D, Schomacher L, Schule KM, Mallick M, Musheev MU, Karaulanov E, … Niehrs C. (2019). NEIL1 and NEIL2 DNA glycosylases protect neural crest development against mitochondrial oxidative stress. eLife, 8, 1–38. 10.7554/eLife.49044 [DOI] [PMC free article] [PubMed] [Google Scholar]
- Hatch VL, Marin-Barba M, Moxon S, Ford CT, Ward NJ, Tomlinson ML, … Wheeler GN (2016). The positive transcriptional elongation factor (P-TEFb) is required for neural crest specification. Developmental Biology, 416(2), 361–372. 10.1016/j.ydbio.2016.06.012 [DOI] [PubMed] [Google Scholar]
- Helms JA, Cordero D, & Tapadia MD (2005). New insights into craniofacial morphogenesis. Development, 132(5), 851–861. 10.1242/dev.01705 [DOI] [PubMed] [Google Scholar]
- Johnston MC, & Bronsky PT (1995). Prenatal craniofacial development: New insights on normal and abnormal mechanisms. Critical Reviews in Oral Biology and Medicine, 6(4), 368–422. [DOI] [PubMed] [Google Scholar]
- Karczewski KJ, Francioli LC, Tiao G, Cummings BB, Alföldi J, Wang Q, . . . MacArthur DG (2019). Variation across 141,456 human exomes and genomes reveals the spectrum of loss-of-function intolerance across human protein-coding genes. bioRxiv, 531210. 10.1101/531210 [DOI] [Google Scholar]
- Kari V, Mansour WY, Raul SK, Baumgart SJ, Mund A, Grade M, … Johnsen SA (2018). Loss of CHD1 causes DNA repair defects and enhances prostate cancer therapeutic responsiveness. EMBO Reports, 19(10), 1609–1623. 10.15252/embr.201846783 [DOI] [PMC free article] [PubMed] [Google Scholar]
- Katayama Y, Nishiyama M, Shoji H, Ohkawa Y, Kawamura A, Sato T, … Nakayama KI (2016). CHD8 haploinsufficiency results in autistic-like phenotypes in mice. Nature, 537(7622), 675–679. 10.1038/nature19357 [DOI] [PubMed] [Google Scholar]
- Kennedy AE, & Dickinson AJ (2012). Median facial clefts in Xenopus laevis: Roles of retinoic acid signaling and homeobox genes. Developmental Biology, 365(1), 229–240. 10.1016/j.ydbio.2012.02.033 [DOI] [PubMed] [Google Scholar]
- Kennedy AE, & Dickinson AJ (2014a). Quantification of orofacial phenotypes in Xenopus. Journal of Visualized Experiments, 93, e52062. 10.3791/52062 [DOI] [PMC free article] [PubMed] [Google Scholar]
- Kennedy AE, & Dickinson AJ (2014b). Quantitative analysis of orofacial development and median clefts in Xenopus laevis. Anatomical Record (Hoboken), 297(5), 834–855. 10.1002/ar.22864 [DOI] [PubMed] [Google Scholar]
- Kitami K, Kitami M, Kaku M, Wang B, & Komatsu Y. (2018). BRCA1 and BRCA2 tumor suppressors in neural crest cells are essential for craniofacial bone development. PLoS Genetics, 14(5), e1007340. 10.1371/journal.pgen.1007340 [DOI] [PMC free article] [PubMed] [Google Scholar]
- Klingenberg CP (2011). MorphoJ: An integrated software package for geometric morphometrics. Molecular Ecology Resources, 11(2), 353–357. 10.1111/j.1755-0998.2010.02924.x [DOI] [PubMed] [Google Scholar]
- Kumar S, Sandell LL, Trainor PA, Koentgen F, & Duester G. (2012). Alcohol and aldehyde dehydrogenases: Retinoid metabolic effects in mouse knockout models. Biochimica et Biophysica Acta, 1821(1), 198–205. 10.1016/j.bbalip.2011.04.004 [DOI] [PMC free article] [PubMed] [Google Scholar]
- Lalevee S, Anno YN, Chatagnon A, Samarut E, Poch O, Laudet V, … Rochette-Egly C. (2011). Genome-wide in silico identification of new conserved and functional retinoic acid receptor response elements (direct repeats separated by 5 bp). The Journal of Biological Chemistry, 286(38), 33322–33334. 10.1074/jbc.M111.263681 [DOI] [PMC free article] [PubMed] [Google Scholar]
- Lansdon LA, Darbro BW, Petrin AL, Hulstrand AM, Standley JM, Brouillette RB, … Manak JR (2018). Identification of Isthmin 1 as a novel Clefting and craniofacial patterning gene in humans. Genetics, 208(1), 283–296. 10.1534/genetics.117.300535 [DOI] [PMC free article] [PubMed] [Google Scholar]
- Li W, Xiong Y, Shang C, Twu KY, Hang CT, Yang J, … Chang CP (2013). Brg1 governs distinct pathways to direct multiple aspects of mammalian neural crest cell development. Proceedings of the National Academy of Sciences of the United States of America, 110(5), 1738–1743. 10.1073/pnas.1218072110 [DOI] [PMC free article] [PubMed] [Google Scholar]
- Linder B, Cabot RA, Schwickert T, & Rupp RA (2004). The SNF2 domain protein family in higher vertebrates displays dynamic expression patterns in Xenopus laevis embryos. Gene, 326, 59–66. 10.1016/j.gene.2003.09.053 [DOI] [PubMed] [Google Scholar]
- Lukacs M, Roberts T, Chatuverdi P, & Stottmann RW (2019). Glycosylphosphatidylinositol biosynthesis and remodeling are required for neural tube closure, heart development, and cranial neural crest cell survival. Elife, 8. 10.7554/eLife.45248 [DOI] [PMC free article] [PubMed] [Google Scholar]
- Macri S, Simula L, Pellarin I, Pegoraro S, Onorati M, Sgarra R, … Vignali R. (2016). Hmga2 is required for neural crest cell specification in Xenopus laevis. Developmental Biology, 411(1), 25–37. 10.1016/j.ydbio.2016.01.014 [DOI] [PubMed] [Google Scholar]
- Maden M. (1999). Heads or tails? Retinoic acid will decide. BioEssays, 21 (10), 809–812. [DOI] [PubMed] [Google Scholar]
- Marcucio R, Hallgrimsson B, & Young NM (2015). Facial morphogenesis: Physical and molecular interactions between the brain and the face. Current Topics in Developmental Biology, 115, 299–320. 10.1016/bs.ctdb.2015.09.001 [DOI] [PMC free article] [PubMed] [Google Scholar]
- Mark M, Ghyselinck NB, & Chambon P. (2004). Retinoic acid signalling in the development of branchial arches. Current Opinion in Genetics & Development, 14(5), 591–598. 10.1016/j.gde.2004.07.012 [DOI] [PubMed] [Google Scholar]
- Mark M, Lohnes D, Mendelsohn C, Dupe V, Vonesch JL, Kastner P, … Chambon P. (1995). Roles of retinoic acid receptors and of Hox genes in the patterning of the teeth and of the jaw skeleton. The International Journal of Developmental Biology, 39(1), 111–121. [PubMed] [Google Scholar]
- Mayor R, & Theveneau E. (2013). The neural crest. Development, 140(11), 2247–2251. 10.1242/dev.091751 [DOI] [PubMed] [Google Scholar]
- Mefford HC, Cooper GM, Zerr T, Smith JD, Baker C, Shafer N, … Eichler EE (2009). A method for rapid, targeted CNV genotyping identifies rare variants associated with neurocognitive disease. Genome Research, 19(9), 1579–1585. 10.1101/gr.094987.109 [DOI] [PMC free article] [PubMed] [Google Scholar]
- Michailovici I, Eigler T, & Tzahor E. (2015). Craniofacial muscle development. Current Topics in Developmental Biology, 115, 3–30. 10.1016/bs.ctdb.2015.07.022 [DOI] [PubMed] [Google Scholar]
- Milet C, & Monsoro-Burq AH (2012). Neural crest induction at the neural plate border in vertebrates. Developmental Biology, 366(1), 22–33. 10.1016/j.ydbio.2012.01.013 [DOI] [PubMed] [Google Scholar]
- Mills AA (2017). The Chromodomain helicase DNA-binding chromatin remodelers: Family traits that protect from and promote cancer. Cold Spring Harbor Perspectives in Medicine, 7(4), 1–15. 10.1101/cshperspect.a026450 [DOI] [PMC free article] [PubMed] [Google Scholar]
- Minoux M, & Rijli FM (2010). Molecular mechanisms of cranial neural crest cell migration and patterning in craniofacial development. Development, 137(16), 2605–2621. 10.1242/dev.040048 [DOI] [PubMed] [Google Scholar]
- Mitchel PJ., Timmon PM., Heber JM., Rigb PW., & Tjia R. (1991). Transcription factor AP-2 is expressed in neural crest cell lineages during mouse embryogenesis. Genes & Development, 5(1), 105–119. [DOI] [PubMed] [Google Scholar]
- Moutier E, Ye T, Choukrallah MA, Urban S, Osz J, Chatagnon A, … Davidson I. (2012). Retinoic acid receptors recognize the mouse genome through binding elements with diverse spacing and topology. The Journal of Biological Chemistry, 287(31), 26328–26341. 10.1074/jbc.M112.361790 [DOI] [PMC free article] [PubMed] [Google Scholar]
- Nieuwkoop PD, & Faber J. (1994). Normal table of Xenopus laevis (Daudin): a systematical and chronological survey of the development from the fertilized egg till the end of metamorphosis. New York: Garland Pub. [Google Scholar]
- Pauli S, Bajpai R, & Borchers A. (2017). CHARGEd with neural crest defects. American Journal of Medical Genetics. Part C, Seminars in Medical Genetics, 175(4), 478–486. 10.1002/ajmg.c.31584 [DOI] [PubMed] [Google Scholar]
- Pilarowski GO, Vernon HJ, Applegate CD, Boukas L, Cho MT, Gurnett CA, … Bjornsson HT (2017). Missense variants in the chromatin remodeler CHD1 are associated with neurodevelopmental disability. Journal of Medical Genetics, 55(8), 561–566. 10.1136/jmedgenet-2017-104759 [DOI] [PMC free article] [PubMed] [Google Scholar]
- Platt RJ, Zhou Y, Slaymaker IM, Shetty AS, Weisbach NR, Kim JA, … Zhang F. (2017). Chd8 mutation leads to autistic-like behaviors and impaired striatal circuits. Cell Reports, 19(2), 335–350. 10.1016/j.celrep.2017.03.052 [DOI] [PMC free article] [PubMed] [Google Scholar]
- Rinon A, Lazar S, Marshall H, Buchmann-Moller S, Neufeld A, Elhanany-Tamir H, … Tzahor E. (2007). Cranial neural crest cells regulate head muscle patterning and differentiation during vertebrate embryogenesis. Development, 134(17), 3065–3075. 10.1242/dev.002501 [DOI] [PubMed] [Google Scholar]
- Rogers CD, & Nie S. (2018). Specifying neural crest cells: From chromatin to morphogens and factors in between. Wiley Interdisciplinary Reviews: Developmental Biology, e322, 1–23. 10.1002/wdev.322 [DOI] [PMC free article] [PubMed] [Google Scholar]
- Rose C. (2009). Generating, growing and transforming skeletal shape: Insights from amphibian pharyngeal arch cartilages. BioEssays, 31(3), 287–299. 10.1002/bies.200800059 [DOI] [PubMed] [Google Scholar]
- Sakai D, & Trainor PA (2016). Face off against ROS: Tcof1/Treacle safeguards neuroepithelial cells and progenitor neural crest cells from oxidative stress during craniofacial development. Development, Growth & Differentiation, 58(7), 577–585. 10.1111/dgd.12305 [DOI] [PMC free article] [PubMed] [Google Scholar]
- Sandell LL, Sanderson BW, Moiseyev G, Johnson T, Mushegian A, Young K, … Trainor PA (2007). RDH10 is essential for synthesis of embryonic retinoic acid and is required for limb, craniofacial, and organ development. Genes & Development, 21(9), 1113–1124. 10.1101/gad.1533407 [DOI] [PMC free article] [PubMed] [Google Scholar]
- Sauka-Spengler T, & Bronner-Fraser M. (2008). A gene regulatory network orchestrates neural crest formation. Nature Reviews. Molecular Cell Biology, 9(7), 557–568. 10.1038/nrm2428 [DOI] [PubMed] [Google Scholar]
- Shimomura T, Kawakami M, Okuda H, Tatsumi K, Morita S, Nochioka K, … Wanaka A. (2015). Retinoic acid regulates Lhx8 expression via FGF-8b to the upper jaw development of chick embryo. Journal of Bioscience and Bioengineering, 119(3), 260–266. 10.1016/j.jbiosc.2014.08.010 [DOI] [PubMed] [Google Scholar]
- Simoes-Costa M, & Bronner ME (2015). Establishing neural crest identity: A gene regulatory recipe. Development, 142(2), 242–257. 10.1242/dev.105445 [DOI] [PMC free article] [PubMed] [Google Scholar]
- Sive HL, Grainger R, & Harland R. (2000). Early development of Xenopus laevis: A laboratory manual. Cold Spring Harbor, NY: Cold Spring Harbor Laboratory Press. [Google Scholar]
- Sperry ED, Hurd EA, Durham MA, Reamer EN, Stein AB, & Martin DM (2014). The chromatin remodeling protein CHD7, mutated in CHARGE syndrome, is necessary for proper craniofacial and tracheal development. Developmental Dynamics, 243(9), 1055–1066. 10.1002/dvdy.24156 [DOI] [PMC free article] [PubMed] [Google Scholar]
- Strobl-Mazzulla PH, Sauka-Spengler T, & Bronner-Fraser M. (2010). Histone demethylase JmjD2A regulates neural crest specification. Developmental Cell, 19(3), 460–468. 10.1016/j.devcel.2010.08.009 [DOI] [PMC free article] [PubMed] [Google Scholar]
- Suzuki S, Nozawa Y, Tsukamoto S, Kaneko T, Manabe I, Imai H, & Minami N. (2015). CHD1 acts via the Hmgpi pathway to regulate mouse early embryogenesis. Development, 142(13), 2375–2384. 10.1242/dev.120493 [DOI] [PubMed] [Google Scholar]
- Tahir R, Kennedy A, Elsea SH, & Dickinson AJ (2014). Retinoic acid induced-1 (Rai1) regulates craniofacial and brain development in Xenopus. Mechanisms of Development, 133, 91–104. 10.1016/j.mod.2014.05.004 [DOI] [PubMed] [Google Scholar]
- Vieux-Rochas M, Bouhali K, Baudry S, Fontaine A, Coen L, & Levi G. (2010). Irreversible effects of retinoic acid pulse on Xenopus jaw morphogenesis: New insight into cranial neural crest specification. Birth Defects Research. Part B, Developmental and Reproductive Toxicology, 89(6), 493–503. 10.1002/bdrb.20269 [DOI] [PubMed] [Google Scholar]
- Wahl SE, Kennedy AE, Wyatt BH, Moore AD, Pridgen DE, Cherry AM, … Dickinson AJ (2015). The role of folate metabolism in orofacial development and clefting. Developmental Biology, 405(1), 108–122. 10.1016/j.ydbio.2015.07.001 [DOI] [PMC free article] [PubMed] [Google Scholar]
- Wahl SE, Wyatt BH, Turner SD, & Dickinson AJG (2018). Transcriptome analysis of Xenopus orofacial tissues deficient in retinoic acid receptor function. BMC Genomics, 19(1), 795. 10.1186/s12864-018-5186-8 [DOI] [PMC free article] [PubMed] [Google Scholar]
- Williams AL, & Bohnsack BL (2019). What’s retinoic acid got to do with it? Retinoic acid regulation of the neural crest in craniofacial and ocular development. Genesis, 57(7–8), e23308. 10.1002/dvg.23308 [DOI] [PubMed] [Google Scholar]
- Winning RS, Shea LJ, Marcus SJ, & Sargent TD (1991). Developmental regulation of transcription factor AP-2 during Xenopus laevis embryogenesis. Nucleic Acids Research, 19(13), 3709–3714. [DOI] [PMC free article] [PubMed] [Google Scholar]
- Yasin H, Gibson WT, Langlois S, Stowe RM, Tsang ES, Lee L, … Zahir FR (2019). A distinct neurodevelopmental syndrome with intellectual disability, autism spectrum disorder, characteristic facies, and macrocephaly is caused by defects in CHD8. Journal of Human Genetics, 64(4), 271–280. 10.1038/s10038-019-0561-0 [DOI] [PubMed] [Google Scholar]
- Zentner GE, Layman WS, Martin DM, & Scacheri PC (2010). Molecular and phenotypic aspects of CHD7 mutation in CHARGE syndrome. American Journal of Medical Genetics - Part A, 152a(3), 674–686. 10.1002/ajmg.a.33323 [DOI] [PMC free article] [PubMed] [Google Scholar]
- Zepeda-Mendoza C, Goodenberger ML, Kuhl A, Rice GM, & Hoppman N. (2019). Familial segregation of a 5q15-q21.2 deletion associated with facial dysmorphism and speech delay. Clinical Case Reports, 7(6), 1154–1160. 10.1002/ccr3.2186 [DOI] [PMC free article] [PubMed] [Google Scholar]
- Zhou J, Li J, Serafim RB, Ketchum S, Ferreira CG, Liu JC, … Yusufzai T. (2018). Human CHD1 is required for early DNA-damage signaling and is uniquely regulated by its N terminus. Nucleic Acids Research, 46(8), 3891–3905. 10.1093/nar/gky128 [DOI] [PMC free article] [PubMed] [Google Scholar]
Associated Data
This section collects any data citations, data availability statements, or supplementary materials included in this article.