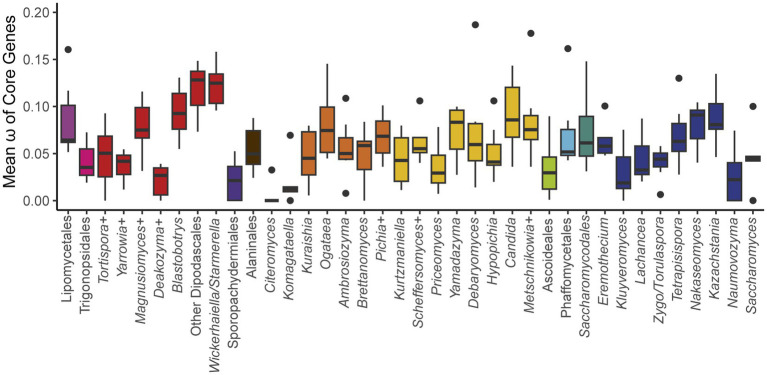
Figure 5.
Mean ω of core genes. The ratio of non-synonymous to synonymous substitution rates for each of the core protein-coding genes was calculated for groups across the phylogeny (+ indicates that additional closely related species that are not currently classified in that genus were included, see Supplementary Table 1). The box and whisker plots show the distribution of ω among genes within each group (boxes centered at median encompassing the interquartile range, whiskers up to 1.5 times the interquartile range, and outlier genes shown as individual datapoints). Two extreme outlier genes were omitted from the graph: ATP8 for Saccharomyces (0.355) and COB for Kurtzmaniella (0.250). Groups with aerobic fermenters, such as Saccharomyces, Kazachstania, and Nakaseomyces, do not exhibit significantly elevated ratios relative to the rest of the subphylum.

