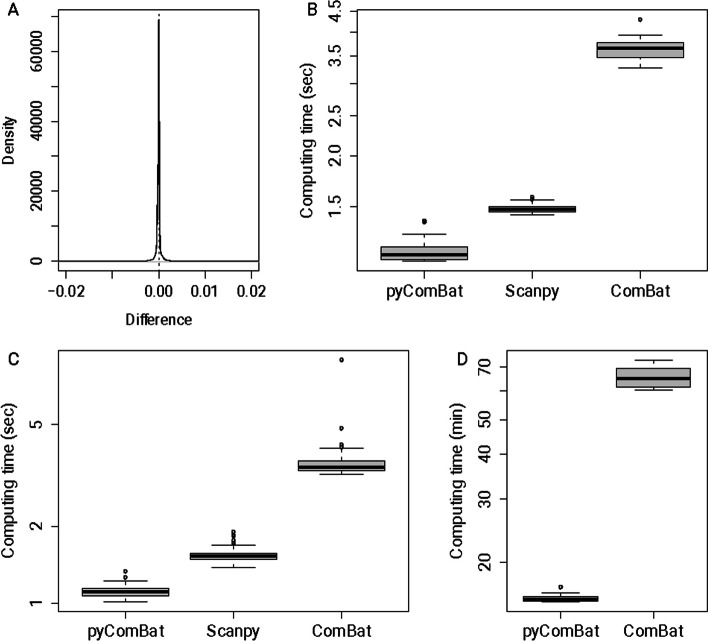
Fig. 1.
Performance of pyComBat vs. Combat vs. Scanpy’s implementation of ComBat. A Distribution of the relative differences between the expression matrices corrected for batch effects, respectively by ComBat and pyComBat (parametric version), on the Ovarian Cancer dataset. The vertical dotted line corresponds to zero. B Computation time in seconds for pyComBat, Scanpy and ComBat for the parametric method, on the Multiple Myeloma dataset. The y-axis is in a log scale. C Computation time in seconds for pyComBat, Scanpy and ComBat for the parametric method, on the Ovarian Cancer dataset. The y-axis is in a log scale. D Computation time in minutes for pyComBat (left) and ComBat (right) for the non-parametric method, on the Ovarian Cancer dataset. The y-axis is in a log scale

