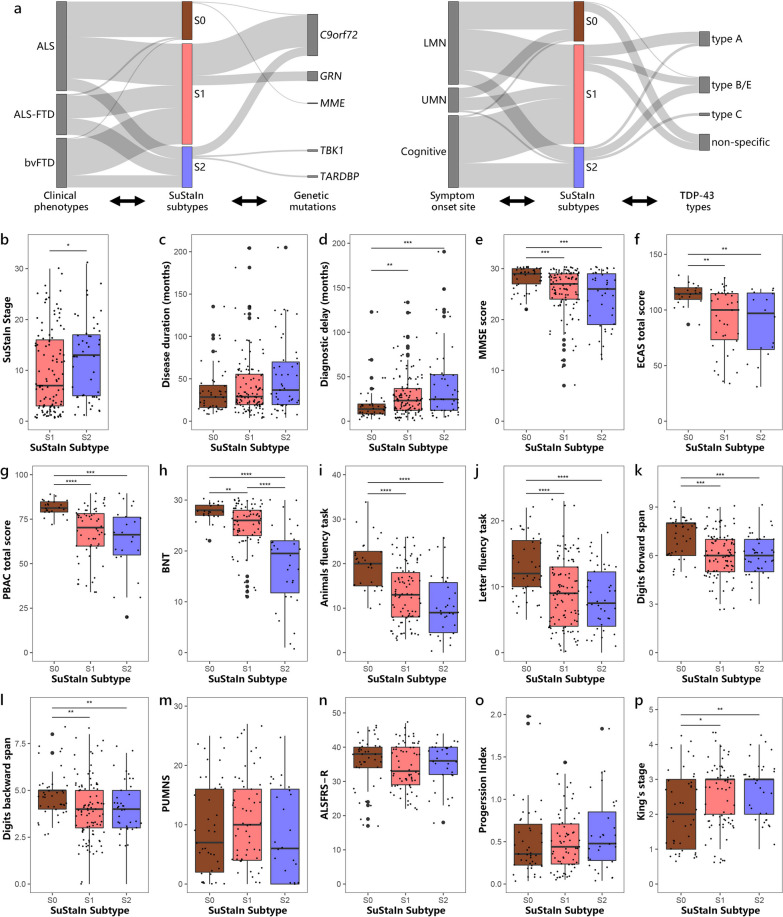
Fig. 4.
Comparison of clinical, genetic and pathological characteristics across subtypes. a Number of clinical phenotypes, cases carrying genetic pathogenic variants, symptom onset sites and TDP-43 types assigned to each subtype. Comparison of b SuStaIn stage, c disease duration, d diagnostic delay, and e–l cognitive scores across subtypes in all individuals. Comparison of m PUMNS, n ALSFRS-R, o progression index, and p King’s stage across subtypes in individuals with ALS/ALS–FTD. *P < 0.05, **P < 0.01, ****P < 0.0001, ****P < 0.0001. S0 Normal-appearing group, S1 Prefrontal/Somatomotor-predominant subtype, S2 Limbic-predominant subtype, MMSE Mini-Mental Status Examination, ECAS Edinburgh Cognitive Assessment Scale, PBAC Philadelphia Brief Assessment of Cognition, BNT Boston naming test, PUMNS Penn Upper Motor Neuron Score, ALSFRS-R Revised ALS Functional Rating Scale, LMN lower motor neuron, UMN upper motor neuron

