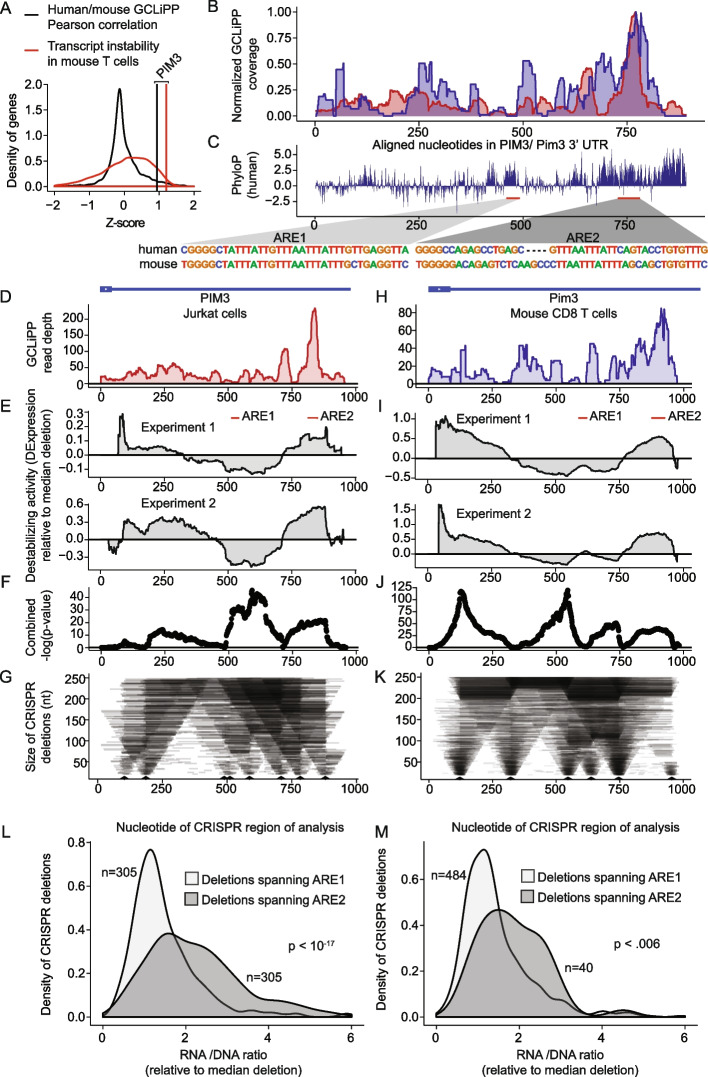
Fig. 6.
Biochemically and functionally shared post-transcriptional regulation of PIM3 in human and mouse cells. A Z-scores of Pearson correlation between mouse and human GCLiPP (black distribution) and transcript instability as measured by comparing transcript read abundance in untreated versus actinomycin D-treated mouse T cells (red distribution) for 7541 genes with matched data. Vertical lines indicate observations for PIM3. B Normalized human and mouse GCLiPP read density and C PhyloP across aligned nucleotides of PIM3 3′ UTR (as depicted in Fig. 5). Insets show sequences of putative regulatory elements. D–G Dissection of human PIM3 3′UTR in Jurkat T cells. D GCLiPP peaks aligned to schematic illustration of 3′UTR. E Change in expression along the 3′UTR relative to median expression of all possible deletions. Per-nucleotide effect score was calculated by comparing median normalized RNA/gDNA ratio for all shown deletions spanning a given nucleotide with median of all shown deletions. Experiment 1 and 2 are biological duplicates which were transfected with 80 or 120 μM of gRNAs respectively. Red bars indicate putative ARE-containing cis-regulatory elements. F Unadjusted − log10 p-values from Welch’s two sample t-test comparing all deletions spanning a nucleotide with all other deletions across both replicate experiments in E. G Size of deletions generated using CRISPR-Cas9. Arrow heads represent gRNA placement. H–K Dissection of mouse PIM3 3′UTR. Data are represented identically to human data, except that mouse primary CD8 T cells were used, and both mouse experiments 1 and 2 used a gRNA concentration of 80 μM. L Effect of deletions spanning putative ARE-containing cis-regulatory elements. The RNA/DNA ratio for mutants deleting ARE1 and ARE2 are shown in human Jurkat T cells. M Same as in L but using data from mouse primary T cells

