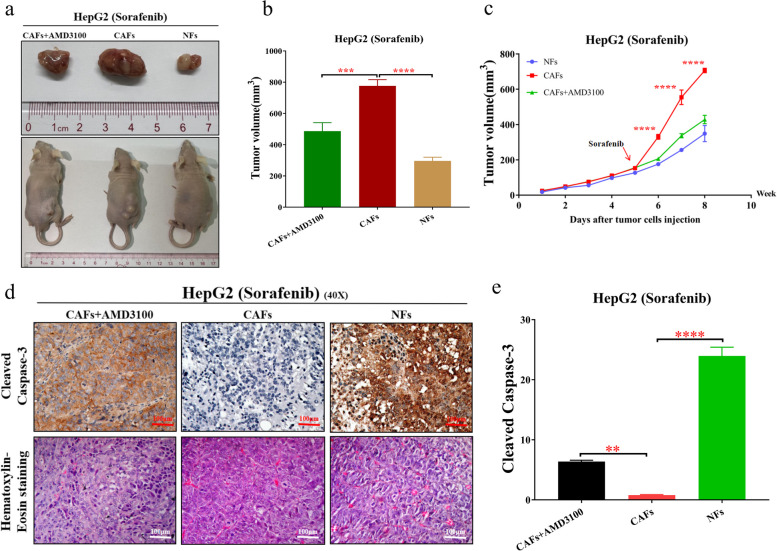
Fig. 5.
CAFs enhance sorafenib resistance of HCC cells through CXCL12 in vivo. a Representative images of tumors in mice of CAFs + AMD3100 group, CAFs group, and NFs group after different treatments. b The tumor volume in different treatment groups. c The tumor proliferation trend in different treatment groups. d Pathological validation of tumors under a microscope (40X), after H&E staining and Immunohistochemistry in tumor tissues. The immunohistochemistry staining to detect the expression of Cleaved Caspase-3 in different treatment groups from the tumor tissues of mice. e The expression level of Cleaved Caspase-3 in different treatment groups from the tumors of mice. The data presented mean ± SEM. **p < 0.001; ***p < 0.0001; ****p < 0.00001

