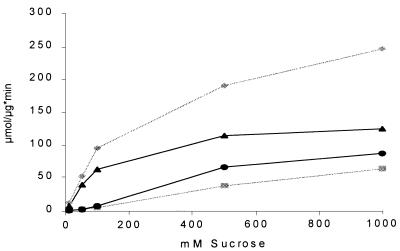
FIG. 7.
Influence of substrate concentration on fructose and kestose production by A. foetidus 1-SST (1 μg/ml) and commercial yeast invertase (1 μg/ml). x axis, sucrose concentration; y axis, micromoles of sugar released per microgram of protein in 1 min. Sugar release by A. foetidus 1-SST is given in black; invertase is indicated in gray. Circles, kestose production by A. foetidus 1-SST; squares, kestose production by invertase; diamonds, fructose release by invertase; triangles, fructose release by A. foetidus 1-SST.

