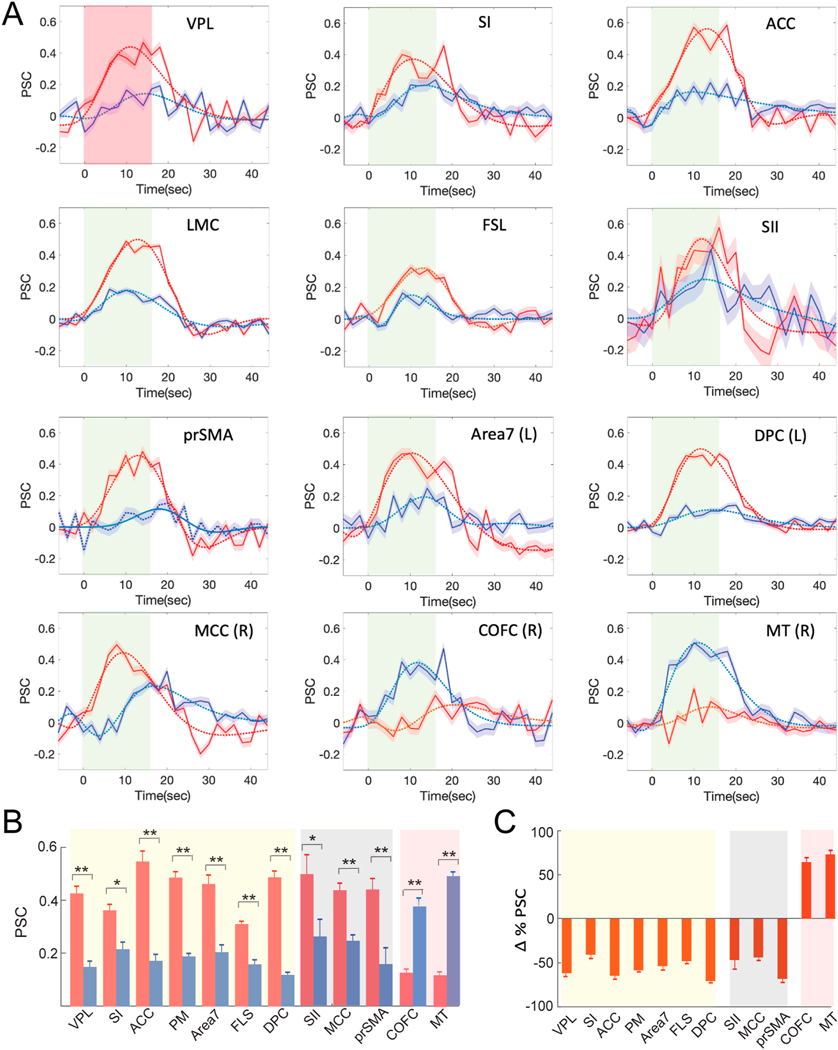
Fig. 5.

Percentage signal change (PSC) during Heat versus Heat + FUS conditions in ten representative brain regions. (A) Stimulus block averaged time courses of PSC (solid lines; mean ± standard error (SE)) extracted from voxels showing statistically significant activation (t > 2, p < 0.05, FDR corrected) within the thalamus (VPL) and representative cortical areas. Panels 1–7: jointly appeared in both stimulus conditions (heat and heat + FUS) activation maps. 8–10: showed suppression when FUS was concurrently applied. 11–12: showed strong response during heat + FUS condition. The dotted lines show the double gamma fitting curves. Line shadow indicates SE. (B) Bar graph of the peaks of PSC in each area (mean ± SE; heat: red; heat + FUS: blue) MWW test (* < 0.05 and ** < 0.005). (C) Percentage signal changes (mean ± SE at each ROI) between heat versus heat + FUS conditions. (For interpretation of the references to color in this figure legend, the reader is referred to the Web version of this article.)
