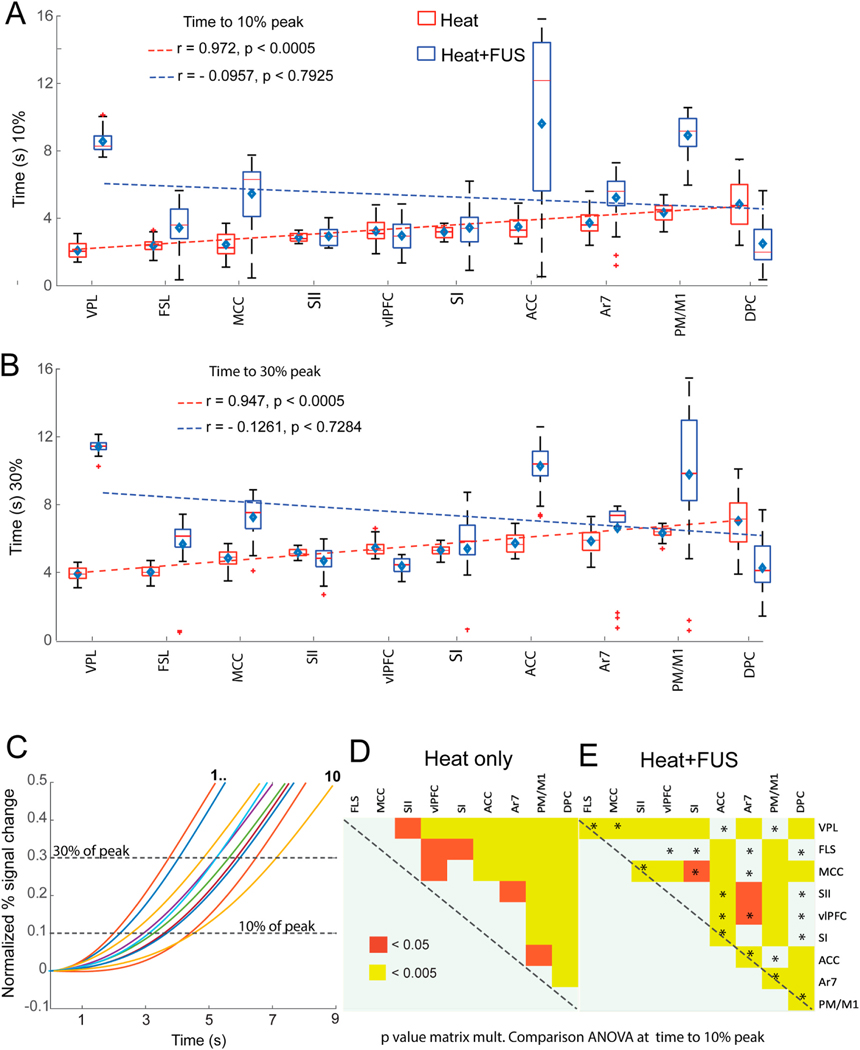
Fig. 6.

Effect of FUS on response latency and inter-regional order. (A–B) Whisker boxplots of time to reach 10% (A) and 30% (B) of the peak PSC for heat (red) and heat + FUS (blue) stimulus conditions. The brain regions are arranged in ascending order of latencies observed with heat stimulation along the x-axis. The dotted blue and red lines refer to the fitting of the median time across brain regions under heat (red) and heat + FUS (blue), respectively. The diamond symbol and short horizontal red bar indicate the median and mean time to reach 10/30% of the pick signal in each region. Pearson’s product-moment correlation of the median response time and corresponding p-values are shown in each panel. (C) Plot of the normalized percentage signal change as a function of time (post-stimulus onset) shows the signal latency to reach 10% and 30% of the peak magnitudes (dotted horizontal lines) in each brain region. Colored lines refer to fitted BOLD PSC time courses arranged in the ROI order displayed in A&B. (D&E) Matrix plots show the statistically significant differences in response time (p < 0.05 & 0.005) measured across ROIs to reach 10% of peak value in the heat (D) and heat + FUS (E) conditions using one-way ANOVA after multiple comparisons. (For interpretation of the references to color in this figure legend, the reader is referred to the Web version of this article.)
