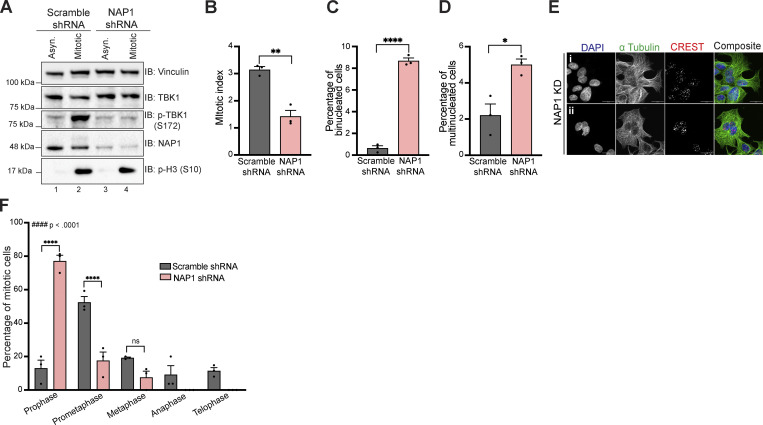
Figure S1.
NAP1 KD for 36 h in DLD-1 cells halts cell division in prophase and prometaphase resulting in mitotic errors. (A) Western blot analysis of p-TBK1 levels in asynchronous and mitotic cells from scramble and NAP1 shRNA KD in DLD-1 cells over 36 h. RO-3306 was used for synchronization. (B–D) Percentage of mitotic (B), binucleated (C), and multinucleated (D) cells from an asynchronous population of either scramble or NAP1 KD for 36 h in DLD-1 cells. Error bars indicate ±SEM; n = 3 independent experiments. Random fields of view were captured sampling ~800 cells per biological replicate from each category. (E) Representative confocal images of NAP1 KD cells: (i) binucleated and (ii) multinucleated cells. DAPI (blue) was used as a nuclear counterstain, a-tubulin for cytoskeleton staining (green), and CREST for kinetochore staining (red). Scale bar, 20 μm.(F) Mitotic stage frequency distribution for scramble or NAP1 KD for 36 h in DLD-1 cells. Error bars indicate ±SEM; n = 3 independent experiments. Random fields of view were captured sampling ~800 cells per biological replicate from each category. Unpaired Student’s t test was performed for all statistical analysis (B–D and F). For F, Student’s t test compared the difference between groups during each phase of mitosis. * P < .05, ** P < .01, **** P <.0001, ns = not significant. Kolmogorov-Smirnov nonparametric test was used to analyze the differences between the frequency distribution between scramble and NAP1 KD in F. #### p < .0001. Source data are available for this figure: SourceData FS1.

