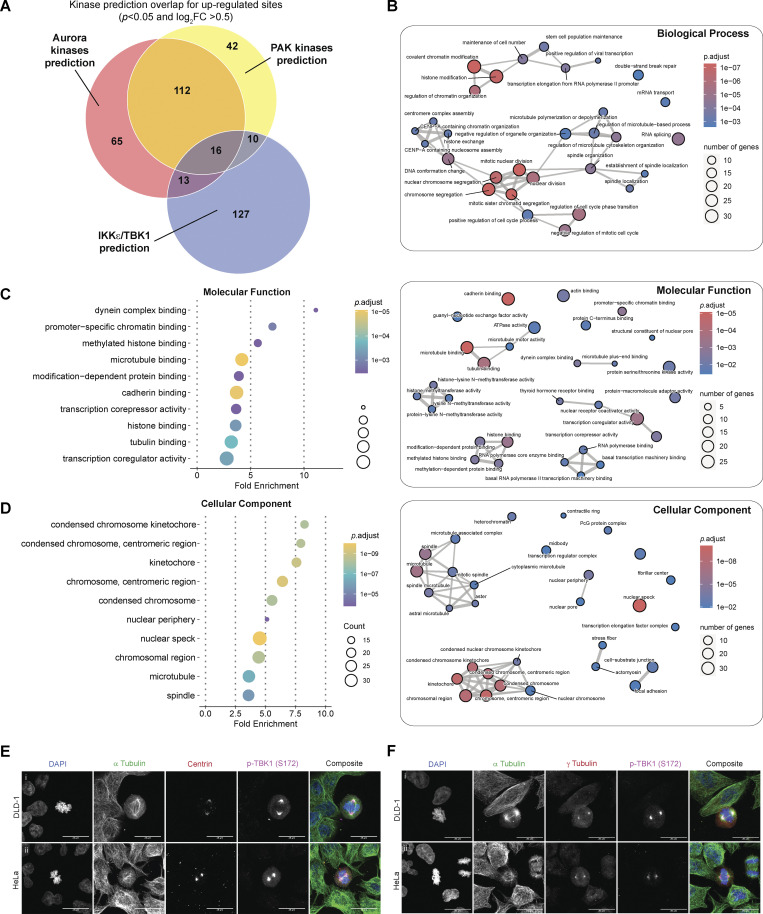
Figure S5.
Gene Ontology terms enrichment analysis and associated enrichment map networks for enriched phosphosites for centrosomal and microtubule associated proteins. (A) Venn diagram illustrating the kinase prediction overlap for upregulated sites passing the P value cutoff of P < 0.05 and log2 ratio cutoff of +0.5. (B–D) Gene Ontology terms enrichment analysis and associated enrichment map networks for enriched phosphor-sites (Tier 2). For enrichment map networks, each node represents a gene set (i.e., a GO term) and each edge represents the overlap between two gene sets. (E) Representative confocal images of centrin (red) and p-TBK1 (magenta) staining in (i) DLD-1 and (ii) HeLa cells. DAPI (blue) was used as a nuclear counterstain and a-tubulin for cytoskeleton staining (green). Scale bar, 20 μm. (F) Representative confocal images of g-tubulin (red) and p-TBK1 (magenta) staining in (i) DLD-1 and (ii) HeLa cells. DAPI (blue) was used as a nuclear counterstain and a-tubulin for cytoskeleton staining (green). Scale bar, 20 μm.

