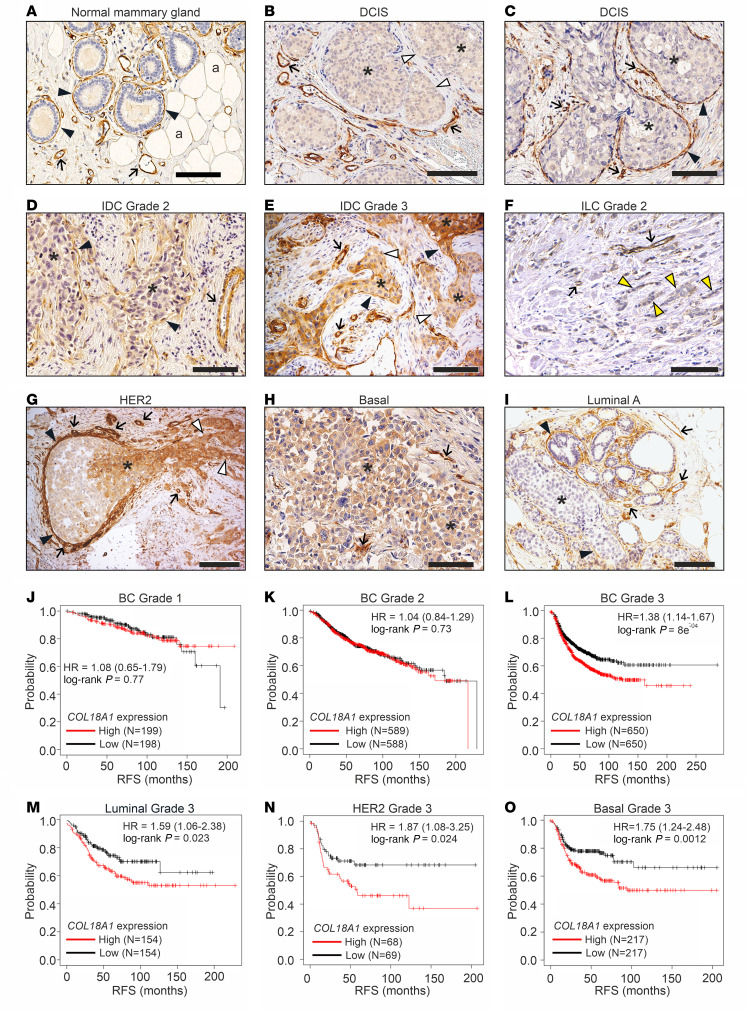
Figure 1. High ColXVIII expression is associated with poor prognosis for human BC.
(A–I). Representative images of ColXVIII expression and localization in (A) normal breast tissue, (B and C) DCIS, (D and E) grade-2 and -3 IDCs, (F) grade-2 ILC, and (G) HER2, (H) basal/TNBC, and (I) luminal A subtypes of BC (n = 730, Supplemental Table 1). Panel G is shown also in Supplemental Figure 2, together with the negative staining control for the mAB DB144-N2 used in IHC (Supplemental Figure 2, M and N). Black arrowheads, epithelial BM; white arrowheads, ColXVIII absent in the epithelial BM; yellow arrowheads, single files of tumor cells in classic ILC; arrows, vascular BM; asterisks, cytoplasmic staining in tumor cells; a, adipocyte. Scale bars: 100 μm. (J–O) Kaplan-Meier plots showing RFS of patients with BC stratified by COL18A1 mRNA expression levels (probe: 209082_s_at) by cancer grade (J–L) and by cancer subtype (M–O, also shown in Supplemental Figure 5 together with other survival data of BC subtypes). High ColXVIII expression, red line; low ColXVIII expression, black line. The open access gene expression data and patients’ survival information from The Cancer Genome Atlas (TCGA), the Gene Expression Omnibus (GEO) database, and the European Genome Archive (EGA), compiled in a single database at www.kmplot.com (22), were used for the meta-analyses. HRs and log-rank P values were computed using the median ColXVIII expression level as the cutoff. The initial number of patients in each group is indicated in the survival graphs.

