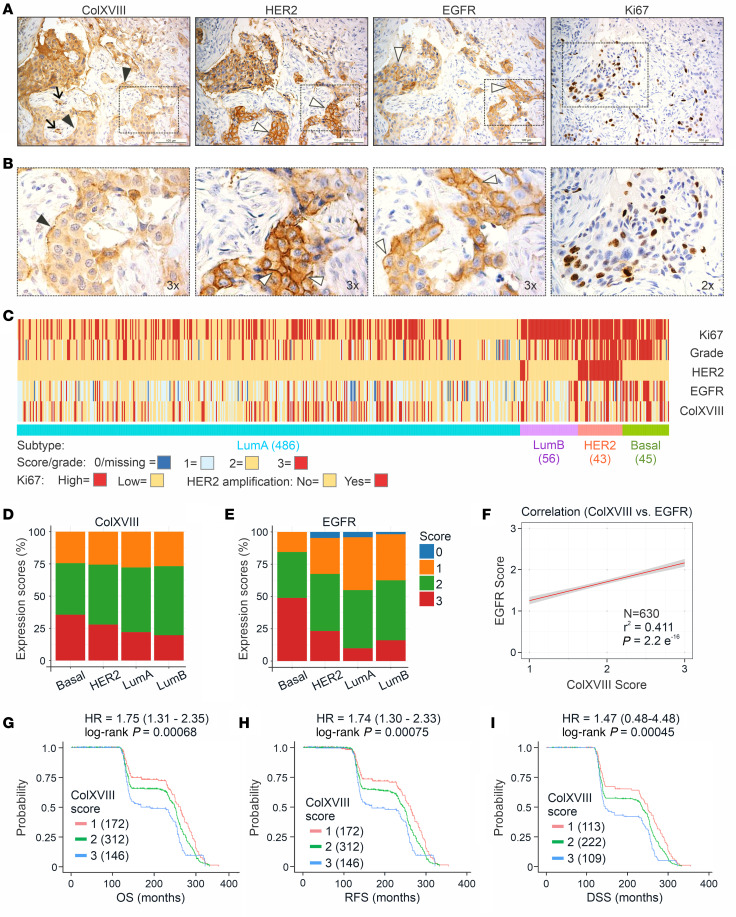
Figure 2. Expression of ColXVIII and routine BC biomarkers in human BC.
(A) Representative images of IHC staining for ColXVIII, EGFR, HER2, and Ki67 in sequential sections of HER2 subtype BC (n = 70, Supplemental Table 1). Scale bars: 200 μm. Arrow, vascular BM; black arrowheads, epithelial BM; white arrowheads, EGFR or HER2 signal on the plasma membrane. (B) Magnified regions indicated in A (original magnification, ×2 and ×3). (C) Heatmap showing IHC scores for ColXVIII and EGFR, HER2 and Ki67 status, and nuclear tumor grades for BC samples from the Uppsala/Umeå cohort, grouped by BC subtypes. Samples analyzed for each molecular subtype: HER2, n = 43; luminal B, n = 56; luminal A, n = 486; and TNBC, n = 45. IHC scores and nuclear grades are indicated in different colors. (D and E) Proportions of IHC scores for ColXVIII and EGFR in BC subtypes in the Uppsala/Umeå cohort. (F) Correlation between the ColXVIII and EGFR scores in the Uppsala/Umeå cohort, calculated using the Kendall rank correlation coefficient (Kendall Tau). In C–F, n = 630. (G) Kaplan-Meier plots showing OS (n = 630), RFS (n = 630), and disease-specific survival (DSS) (n = 444) for the Uppsala/Umeå cohort of patients with BC, stratified by cytoplasmic ColXVIII protein expression levels. HR and log-rank P values were computed using the ColXVIII IHC scores as thresholds for stratification. The initial number of patients in each group is indicated in the survival graphs.

