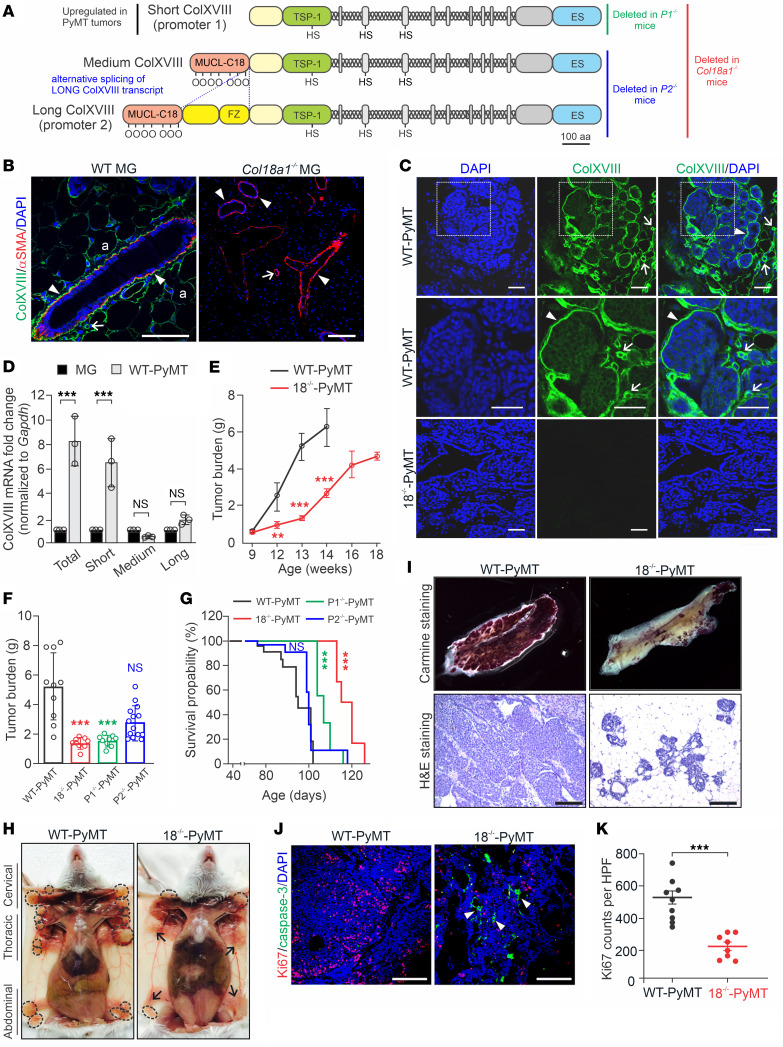
Figure 4. The short ColXVIII isoform promotes mammary tumor growth in mice.
(A) Structures of 3 α1(XVIII) collagen chains and Col18a1 mouse models. (B and C) ColXVIII expression (green) in MGs of WT and ColXVIII-KO (Col18a1–/–) females (n = 3) (B) and in WT MMTV-PyMT (WT-PyMT) and Col18a1–/– MMTV-PyMT (18–/–-PyMT) mammary tumors (n ≥10) (C). αSMA (red) in myoepithelial cells and vascular smooth muscle cells (B). Arrowheads, epithelial BM; arrows, vascular BM; a, adipocyte. (D) Expression of short, medium, and long Col18a1 transcripts normalized to Gapdh in WT MGs and WT-PyMT tumors (n = 3). (E) Tumor burden in WT-PyMT and 18–/–-PyMT mice at 9–18 weeks of age (n ≥3 per genotype at each time point). (F) Mammary tumor burden at week 13 in WT-PyMT (n = 10), 18–/–-PyMT (n = 9), P1-PyMT (n = 9), and P2-PyMT (n = 14) mice. (G) Kaplan-Meier plots for WT-PyMT (n = 38), 18–/–-PyMT (n = 31), P1-PyMT (n = 28), and P2-PyMT (n = 33) mice. (H) Tumors (circles) in MGs of WT-PyMT and 18–/–-PyMT mice at week 13. Arrows indicate macroscopically normal MGs. (I) Carmine Alum-stained MGs and H&E-stained WT-PyMT and 18–/–-PyMT tumor sections at week 13 (n ≥6). (J) Ki67 (red) and cleaved caspase-3 (green) in WT-PyMT and 18–/–-PyMT tumors. Arrowheads point to apoptotic cells in the 18–/–-PyMT specimen. (K) Ki67+ cells in WT-PyMT (n = 9) and 18–/–-PyMT tumors (n = 8) (4 fields/tumor at ×20). Scale bars: 200 μm (B, C, I, and J). **P < 0.01 and ***P < 0.001, by 2-tailed Student’s t test (D, E, and K), 1-way ANOVA with Bartlett’s post-correction test for equal variances (F), and Mantel-Cox test (G). Error bars indicate the SEM.

