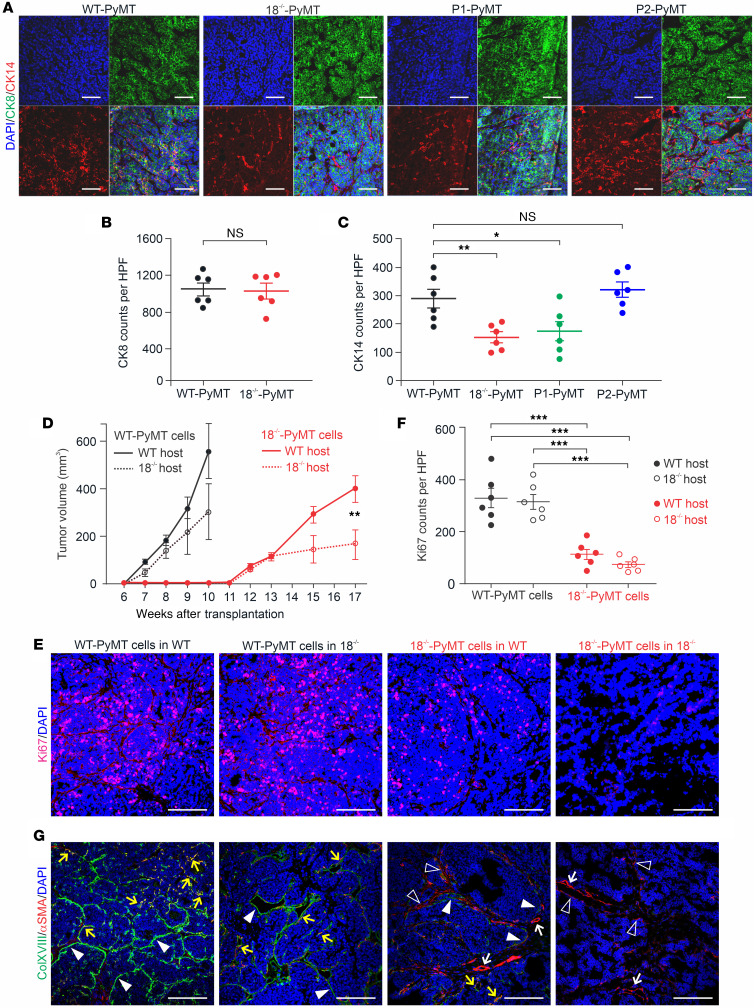
Figure 5. Expression of cytokeratins in PyMT tumors and orthotopic allograft transplantation experiments.
(A) Representative images of immunostaining of CK8 and CK14 in WT-PyMT, 18–/–-PyMT, P1-PyMT, and P2-PyMT tumors. (B) Quantification of CK8+ luminal cells in WT-PyMT and 18–/–-PyMT tumors. (C) Quantification of CK14+ basal cells in WT-PyMT, 18–/–-PyMT, P1-PyMT, and P2-PyMT tumors. In B and C, n = 6/genotype; n = 4 random fields/tumor at ×20. (D) Growth rates of transplanted WT-PyMT and 18–/–-PyMT tumors in WT and Col18a1–/– hosts. Number of mice (N) and allograft tumors (n): WT-PyMT cells in WT hosts and 18–/–-PyMT cells in WT hosts (N = 12, n = 24), WT-PyMT cells in Col18a1–/– hosts and 18–/–-PyMT cells in Col18a1–/– hosts (N = 6, n = 12). (E) Representative images of Ki67 immunostaining in WT-PyMT and 18–/–-PyMT allografts. (F) Quantification of the Ki67+ cell counts in transplanted tumors (n = 6/group, n = 4 random fields/tumor at ×20). (G) Representative images of ColXVIII (green) and αSMA (red) expression in allograft tumors. Arrowheads indicate ColXVIII+ structures or cells at tumor borders; open arrowheads show αSMA+ cells; yellow arrows point to αSMA and ColXVIII double-positive structures and cells; white arrows indicate αSMA+ blood vessels. Scale bars: 200 μm (A, E, and G). DAPI, blue. *P < 0.05, **P < 0.01, and ***P < 0.01, by 2-tailed Student’s t test (B and D) and 2-way ANOVA with Dunnett’s multiple-comparison test (C and F). Error bars indicate the SEM.

