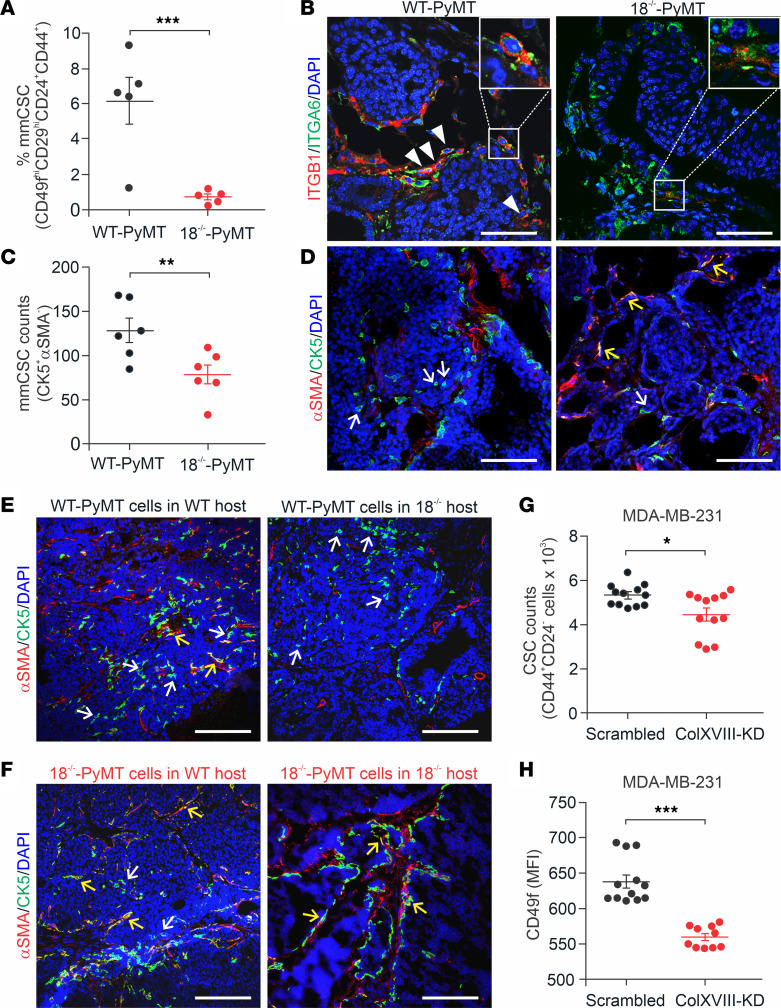
Figure 6. ColXVIII expression in mouse mammary CSCs.
(A) Quantification of FACS-sorted CD44+, CD24+, CD29hi, and CD49fhi mouse mammary CSCs (mmCSC) from tumors from 13-week-old WT-PyMT and 18–/–-PyMT mice (n = 5 per genotype; n = 3 technical replicates for each). (B) Representative images of ITGB1 (CD29, red) and ITGA6 (CD49f, green) immunofluorescence staining of mammary tumors at week 13. Arrowheads indicate CD29 and CD49f double-positive cells in WT-PyMT tumors. Insets show strongly double-positive cells in WT-PyMT tumors and weakly double-positive cells in 18–/–-PyMT tumors (n = 5). Original magnification of insets, ×2.5. (C and D) Analysis of CK5 and αSMA expression in WT-PyMT and 18–/–-PyMT tumor tissues at week 13. (C) Quantification of discrete CK5+ and αSMA– cells (n = 6 per genotype; n = 4 random fields/tumor at ×20). (D) Representative images of CK5 (green) and αSMA (red) staining. (E and F) Representative images of CK5 (green) and αSMA (red) staining in allograft tumors. White arrows show CK5+ and αSMA– progenitor cells; yellow arrows point to CK5/αSMA double-positive mature myoepithelial cells (n ≥6). (G) CSC populations in the ColXVIII siRNA–transfected KD and scrambled vector–transfected control MDA-MB-231 cells, as estimated by FACS-sorted CD44+ CD24lo/– cells. (H) Quantification of the MFI of CD49f+ cells in ColXVIII-KD and control MDA-MB-231 cells. n = 4 biological replicates; n = 3 technical replicates (G and H). Scale bars: 100 μm (B, D, E and F). DAPI, blue. *P < 0.05, **P < 0.01, and ***P < 0.001, by 2-tailed Student’s t test (A, C, G and H). Error bars indicate the SEM.

