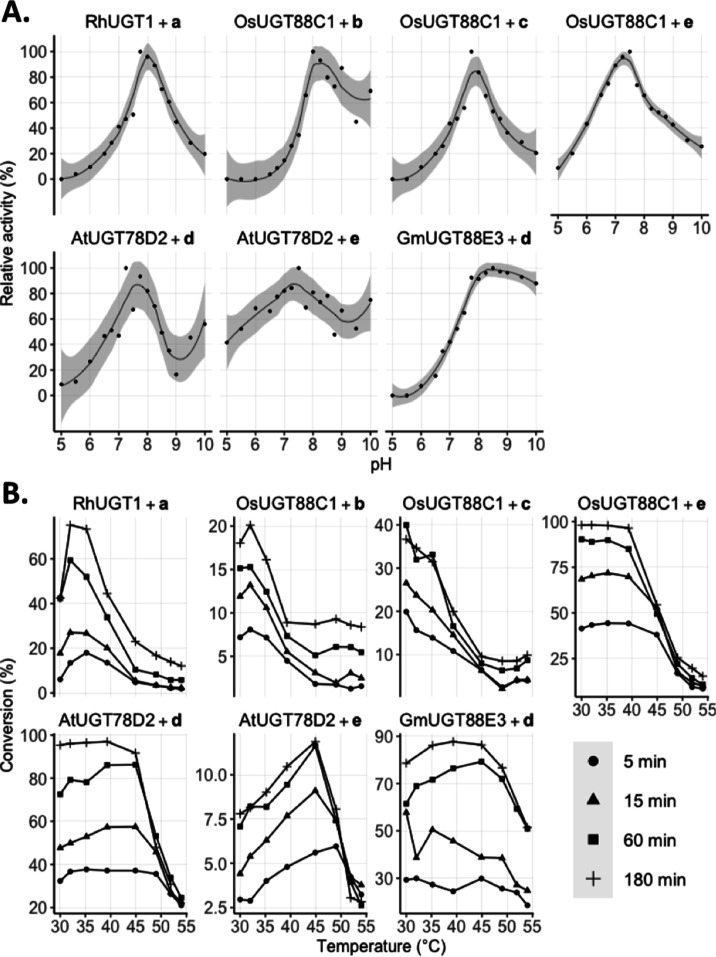
Figure 1.
Biochemical characterization. Carried out with 100 μM acceptor and 500 μM UDP-Glc in the presence of UGT as described in the Experimental Section. (A) Initial rate of product formation is plotted against the corresponding pH value. The maximum activity is defined as the highest observed rate of product formation at 293 K. (B) Temperature profiles for each reaction pair corresponding to analytical yields of product formation at optimal pH as determined in (A) and at different time points.

