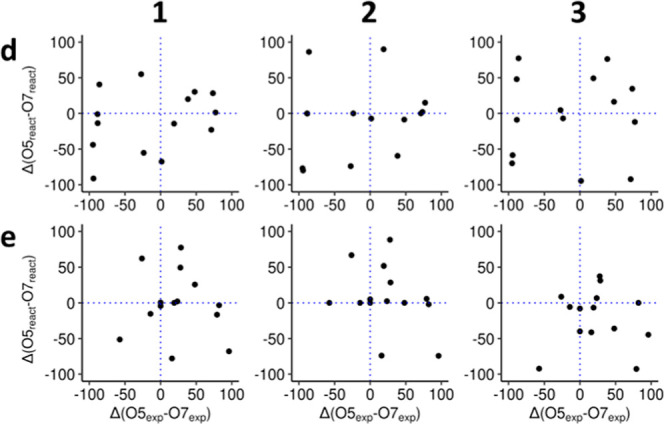
Figure 4.

Simulated preferences against experimental preferences for acceptors d and e and the 14 UGTs that show stereospecificity against d or e. Positive values on the x-axis indicate excess of 5-O-glucoside. Positive values on the y-axis indicate excess of reactive poses for 5-O-glycosylation. Dotted lines indicate boundaries between preferences.
