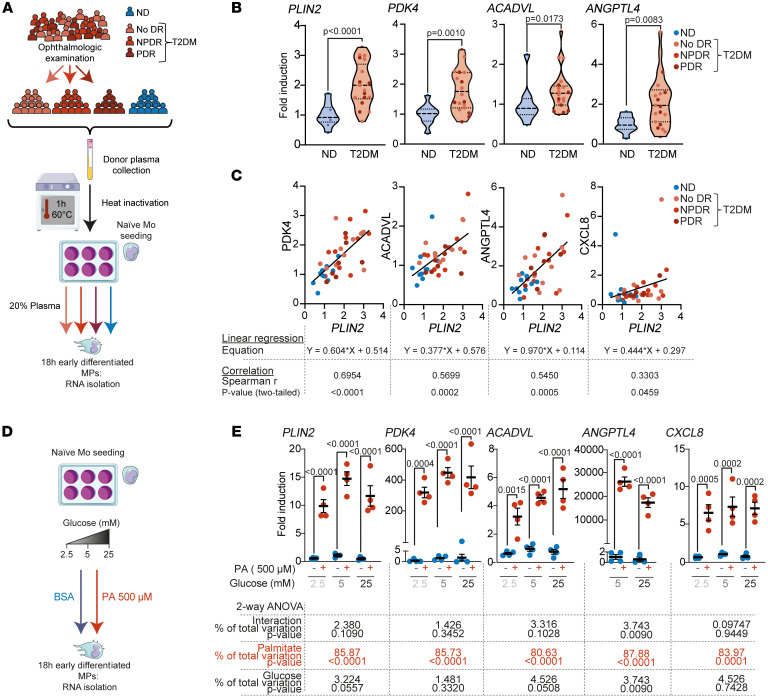
Figure 3. T2DM plasma, but not glucose, induces a lipid-associated phenotype in MPs.
(A) Schematic representation of donor phenotyping and group attribution, plasma preparation, and naive Mo treatment. (B and C) RT-qPCR quantification of healthy donor naive Mos treated for 18 hours with donor plasma from ND individuals (n = 10 [blue dots]) or patients with T2DM (n = 27, no DR [light pink dots], NPDR [pink dots], PDR [dark red dots]). (B) Violin plot representation of the relative expression of the indicated genes in response to individual donor plasma exposure. Dashed lines represent the median and quartiles. P values were determined using a 2-tailed Mann-Whitney U test. (C) Simple linear regression representation of PDK4, ACADVL, ANGPTL4, and CXCL8 (y axis) and PLIN2 expression (x axis). Correlations between expression levels were analyzed using Spearman’s correlation; the linear regression equation, Spearman’s r [95% CI], and 2-tailed P values are given below each correlation graph. (D) Schematic representation of naive Mo treatment with PA and increasing concentrations of glucose. (E) Scatter plot representation of RT-qPCR expression of selected markers in healthy donor naive Mos treated for 18 hours (or 42 hours for ANGPTL4) with either BSA (unbound BSA, blue dots) or PA (BSA-bound PA, red dots) and various concentrations of glucose. Values represent the mean ± SEM of 4 independent cultures. Statistical differences were analyzed by 2-way ANOVA interaction, and P values for the PA and glucose treatments are given below each graph.

