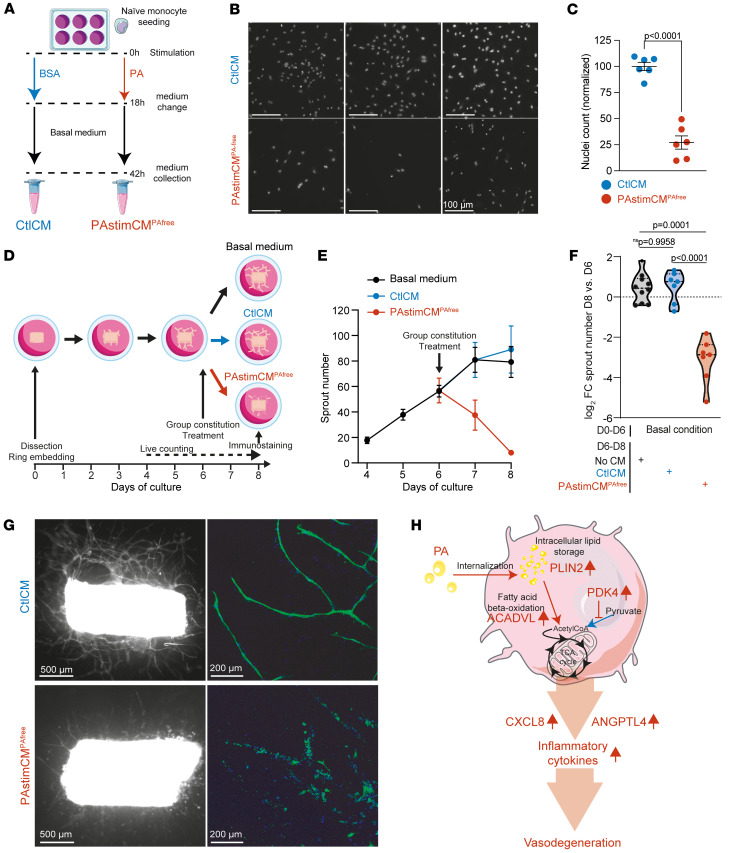
Figure 5. Lipid-associated MPs show vasodegenerative properties.
(A) Schematic representation of the preparation of CtlCM and PAstimCMPAfree from healthy donor Mos treated with PA (PA-bound BSA) or BSA (unbound BSA). (B and C) HUVECs were stimulated with either CtlCM or PAstimCMPAfree. (B) Epifluorescence images of HUVEC nuclei stained with Hoescht (white). Scale bars: 100 μm. (C) Scatter plot of normalized nuclei counts. Values represent the mean ± SEM of 6 independent culture points. The P value was determined using Welch’s 2-tailed t test. (D–G) Capillary degeneration was quantified in an ex vivo assay (48). (E) Time-course of the mean ± SEM sprout number between day 4 (D4) and day 8 (D8) in the 3 treatment groups: basal medium (n = 10, black), CtlCM (n = 7, blue), and PAstimCMPAfree (n = 7, red). (F) Violin plot of the log2 FC of sprout numbers between paired day-6 and day-8 rings; dots represent individual aortic rings, and dashed lines represent the median and quartiles. P values were determined by 1-way Welch’s ANOVA test (P < 0.0001) followed by Dunnett’s T3 multiple-comparison test. (G) Aortic rings and sprouts treated with CtlCM or PAstimCMPAfree on day 6 and stained with COL4 on day 8. Left: Epifluorescence micrographs of COL4 (white). Scale bars: 500 μm. Right: Higher-magnification confocal micrographs of COL4 (green). Scale bars: 200 μm. Nuclei were stained with Hoechst (blue). (H) Schematic of the biological changes in Mos after lipid exposure and their acquired properties.

