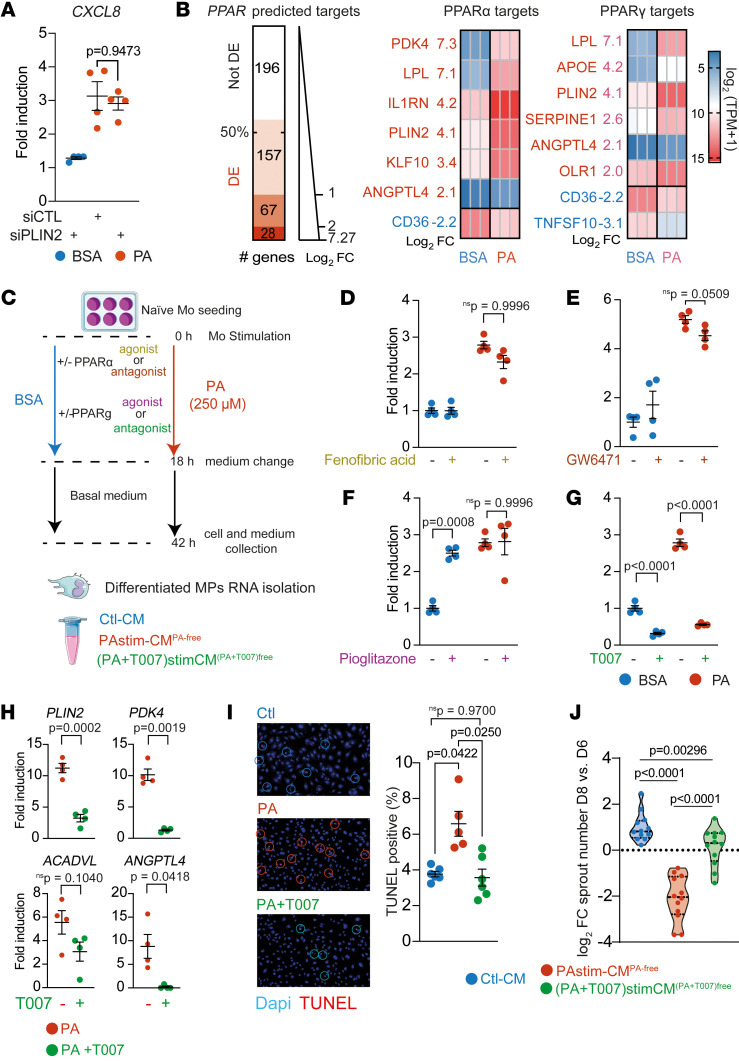
Figure 6. Inhibition of PPARγ signaling normalizes the PA-induced lipid-associated phenotype.
(A) Scatter plot of RT-qPCR quantification of CXCL8 in THP-1 cells transfected with the indicated siRNA and treated with BSA (unbound BSA) or PA (PA-bound BSA). P values were determined by 1-way Welch’s ANOVA test (P = 0.0136) followed by Dunnett’s T3 multiple-comparison test. (B) Left: Graph of high-confidence predicted PPAR target genes (49) differentially expressed in naive Mos treated with PA. Middle and right: Heatmaps of the expression level (TPM) of curated PPARα target genes with a log2 FC of 2 or higher (middle) and curated PPARγ target genes with a log2 FC of 2 or higher (right). (C) Schematic of the stimulation of naive Mos with PA or BSA and PPAR modulators. (D–G) Scatter plots of RT-qPCR quantification of CXCL8 in healthy donor naive Mos treated with either PA or BSA and with (D) fenofibric acid PPARα agonist (P values for interaction, P = 0.0790; PA effect, P < 0.0001; and drug effect, P = 0.0760); (E) GW6471 PPARα antagonist (P = 0.0570, P < 0.0001, and P = 0.9448); (F) pioglitazone PPARγ agonist (P = 0.0027, P = 0.0002, and P = 0.0021); or (G) T0070907 (T007) PPARγ antagonist (all P < 0.0001). Interactions and P values and were determined by 2-way ANOVA followed by Tukey’s multiple-comparison test. (H) Scatter plots of RT-qPCR quantification of the indicated genes in healthy donor naive Mos treated with PA plus T007. P values were determined using a t test with Welch’s correction. (I) Representative images and scatter plot of TUNEL+ HUVECs after stimulation with CtlCM, PAstimCMPAfree, or PAstim+T007-CMPA&T007-free. P values were determined by 2-way Welch’s ANOVA (P < 0.0046) followed by Dunnett’s T3 multiple-comparison test. (J) Violin plot of the log2 FC of sprout numbers between paired rings before and after stimulation with CtlCM, PAstimCMPAfree, or PAstim+T007-CMPA&T007free. Dashed lines indicate the median and quartiles. P values were determined by 1-way Welch’s ANOVA (P < 0.0001) followed by Dunnett’s T3 multiple-comparison test.

