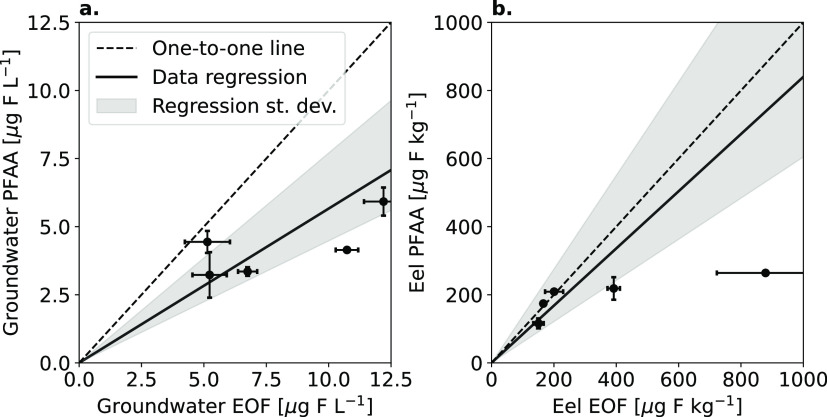
Figure 5.
Comparison of the sum of PFAA and EOF in groundwater (a) and eel (b). Averages (circles) and standard deviations (error bars) from triplicate extractions (n = 3) are shown for each lab. The dotted black line represents the one-to-one line. The black data regression line represents the one-to-one line multiplied by the interlaboratory average estimate of the quantified EOF fraction. The standard deviation of the interlaboratory average estimate is shown in the shaded gray region. Raw data are provided in Tables S11 and S12.

