Table 2.
Differences in the main variables of interest for the total sample, over time.
| Variable | T1 (n = 73) | T2 (n = 68) | T3 (n = 60) | T2–T1 (n = 68) | T3–T2 (n = 60) | T3–T1 (n = 60) | Graphic representation | |
|---|---|---|---|---|---|---|---|---|
| Anxiety | Mean (SD) | 3.1 (1.81) | 2.9 (1.73) | 2.2 (1.89) | −0.3 (1.82) | −0.7 (1.41) | −1.0 (1.89) |

|
| −0.10 | −0.26 | −0.36 | ||||||
| p | 0.261 | 0.008** | <.001*** | |||||
| Depression | Mean (SD) | 1.4 (1.40) | 1.3 (1.37) | 0.9 (1.36) | −0.1 (1.36) | −0.3 (1.40) | −0.5 (1.78) |

|
| −0.04 | −0.33 | −0.38 | ||||||
| p | 0.771 | 0.053^ | 0.027* | |||||
| QoL | ||||||||
| Disease-related | Mean (SD) | 15.7 (3.05) | 17.4 (2.71) | 19.3 (3.65) | 1.8 (3.69) | 1.9 (3.06) | 3.7 (4.2) |

|
| 0.32 | 0.72 | 1.04 | ||||||
| p | 0.003** | <.001*** | <.001*** | |||||
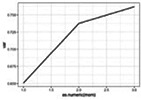
| Physical | Mean (SD) | 2.8 (0.84) | 3.2 (0.73) | 3.3 (0.86) | 0.4 (0.90) | 0.1 (0.76) | 0.5 (0.90) |
|
| 0.41 | 0.14 | 0.55 | ||||||
| p | <.001*** | 0.242 | <.001*** | |||||
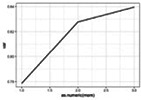
| Mental | Mean (SD) | 3.9 (0.90) | 4.2 (0.74) | 4.4 (0.85) | 0.3 (1.01) | 0.01 (0.88) | 0.3 (1.07) |
|
| 0.27 | 0.07 | 0.34 | ||||||
| p | 0.064^ | 0.647 | 0.026* | |||||
| WIQ | ||||||||
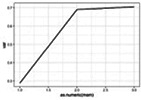
| WIQ distance | Mean (SD) | 28.8 (26.72) | 69.0 (31.79) | 70.4 (35.57) | 39.1 (37.97) | −3.3 (31.62) | 41.5 (35.23) |
|
| 1.41 | 0.38 | 1.79 | ||||||
| p | <.001*** | 0.065^ | <.001*** | |||||
| WIQ speed | Mean (SD) | 20.8 (13.56) | 38.7 (18.16) | 40.7 (25.68) | 17.6 (20.11) | −0.3 (25.02) | 20.1 (26.08) |

|
| 0.89 | 0.21 | 1.10 | ||||||
| p | <.001*** | 0.191 | <.001*** | |||||
| WIQ stairs | Mean (SD) | 40.4 (32.97) | 58.0 (37.01) | 71.2 (34.33) | 16.9 (50.76) | 10.6 (40.27) | 29.9 (45.24) |

|
| 0.86 | 0.48 | 1.34 | ||||||
| p | <.001*** | 0.035* | <.001*** | |||||
| Treadmill walking | ||||||||
| PFWD | Mean (SD) | 122.1 (93.40) | 273.6 (160.28) | 307.9 (202.16) | 151.1 (146.87) | 27.1 (152.65) | 183.6 (185.46) |

|
| 151.34 | 31.50 | 182.84 | ||||||
| p | <.001*** | 0.132 | <.001*** | |||||
| FWD | Mean (SD) | 188.6 (120.97) | 363.7 (174.32) | 399.6 (210.97) | 175.2 (157.44) | 24.2 (158.70) | 206.6 (173.34) |

|
| 175.17 | 30.26 | 205.43 | ||||||
| p | <.001*** | 0.154 | <.001*** | |||||
| MWD | Mean (SD) | 301.0 (139.23) | 478.4 (227.37) | 540.0 (277.37) | 177.1 (192.52) | 35.0 (171.60) | 228.5 (222.08) |

|
| 0.84 | 0.51 | 1.35 | ||||||
| p | <.001*** | <.001*** | <.001*** | |||||
| 6-minute walking | ||||||||
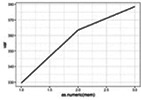
| 6MWD | Mean (SD) | 329.5 (77.95) | 363.6 (78.52) | 378.5 (78.40) | 30.8 (58.69) | 7.9 (53.87) | 42.8 (61.21) |
|
| 31.72 | 10.74 | 42.46 | ||||||
| p | 001*** | 0.147 | <.001*** | |||||
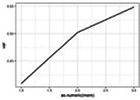
| 6MPM | Mean (SD) | 2.5 (0.91) | 3.0 (1.13) | 3.3 (1.25) | 0.7 (1.24) | 0.2 (1.36) | 0.8 (1.14) |
|
| 0.43 | 0.04 | 0.47 | ||||||
| p | <.001*** | 0.750 | <.001*** | |||||
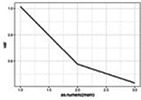
| 6MStop | Mean (SD) | 1.0 (1.24) | 0.6 (0.70) | 0.4 (0.83) | −0.5 (1.29) | −0.1 (0.74) | −0.6 (1.17) |
|
| . | −0.59 | −0.20 | −0.79 | |||||
| p | <.001*** | 0.380 | <.001*** | |||||
Means and graphs obtained with raw data; is the model estimate and p is the p-value provided by the corresponding regression model. PFWD: Pain-free treadmill walking distance (in meters); FWD: Functional treadmill walking distance (in meters); MWD: Maximal treadmill walking distance (in meters); 6 MWD: 6-Minute walk distance (in meters); 6MPM: 6-Minute pain distance (in minutes); 6MStop – 6-Minute number of stops. Significance: ^p < 0.1, *p < 0.05, **p < 0.01, ***p < 0.001. Number of participants (n) may differ in some rows. Significant (or marginally significant) values are highlighted in bold.
