Table 3.
Between-group differences in the main variables of interest, over time.
| Variable | T1 (n = 73) | T2 (n = 68) | T3 (n = 60) | Within-group change | Graphic representation | ||||||||||||
|---|---|---|---|---|---|---|---|---|---|---|---|---|---|---|---|---|---|
| T2–T1 | T3–T2 | T3–T1 | |||||||||||||||
| CG n = 35 | EG n = 38 | EG-CG n = 73 | CG n = 34 | EG n = 34 | EG-CG | CG n = 30 | EG n = 30 | EG-CG | CG n = 34 | EG n = 34 | CG n = 30 | EG n = 30 | CG n = 30 | EG n = 30 | |||
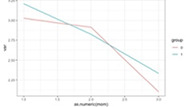
| Anxiety | Mean | 3.0 | 3.2 | 2.9 | 2.8 | 2.1 | 2.3 | −0.1 | −0.6 | −0.9 | −0.5 | −0.9 | −1.1 |
|
|||
| SD | 1.8 | 1.8 | 1.8 | 1.7 | 1.9 | 1.9 | 1.9 | 1.7 | 1.3 | 1.6 | 2.0 | 1.8 | |||||
| 0.07 | −0.06 | 0.07 | −0.03 | 0.16 | −0.33 | −0.20 | −0.36 | −0.35 | |||||||||
| p | 0.700 | 0.760 | 0.715 | 0.781 | 0.193 | 0.021* | 0.152 | 0.010* | 0.008** | ||||||||
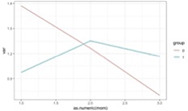
| Depression | Mean | 1.8 | 1.0 | 1.3 | 1.4 | 0.7 | 1.2 | −0.5 | 0.4 | −0.6 | −0.1 | −1.1 | 0.1 |
|
|||
| SD | 1.6 | 1.1 | 1.2 | 1.6 | 1.1 | 1.6 | 1.3 | 1.3 | 1.3 | 1.5 | 1.7 | 1.7 | |||||
| −0.65 | 0.02 | 0.46 | −0.34 | 0.33 | −0.58 | −0.14 | −0.92 | 0.19 | |||||||||
| p | 0.019* | 0.951 | 0.167 | 0.072^ | 0.118 | 0.022* | 0.510 | <.001*** | 0.404 | ||||||||
| QoL | |||||||||||||||||
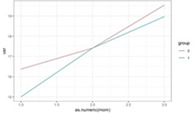
| Disease-related | Mean | 16.4 | 15 | 17.4 | 17.4 | 19.5 | 19.0 | 1.1 | 2.4 | 2.1 | 1.6 | 3.3 | 4.0 |
|
|||
| SD | 3.1 | 2.9 | 2.8 | 2.7 | 3.2 | 4.1 | 3.5 | 3.8 | 3.0 | 3.2 | 4.0 | 4.5 | |||||
| −0.25 | −0.01 | −0.05 | 0.19 | 0.43 | 0.74 | 0.69 | 0.94 | 1.13 | |||||||||
| p | 0.155 | 0.961 | 0.799 | 0.205 | 0.004** | <.001*** | <.001*** | <.001*** | <.001*** | ||||||||
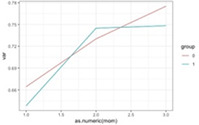
| Physical | Mean | 2.9 | 2.8 | 3.2 | 3.2 | 3.4 | 3.3 | 0.3 | 0.5 | 0.2 | −0.1 | 0.5 | 0.5 |
|
|||
| SD | 0.8 | 0.9 | 0.8 | 0.7 | 0.8 | 0.9 | 0.8 | 1.0 | 0.8 | 0.7 | 0.7 | 1.1 | |||||
| −0.10 | 0.14 | −0.12 | 0.29 | 0.53 | 0.28 | 0.01 | 0.57 | 0.54 | |||||||||
| p | 0.643 | 0.531 | 0.587 | 0.068^ | 0.001** | 0.114 | 0.931 | <.001*** | 0.001** | ||||||||
| Mental | Mean | 3.9 | 3.9 | 4.1 | 4.2 | 4.3 | 4.1 | 0.1 | 0.4 | 0.2 | −0.2 | 0.3 | 0.3 |
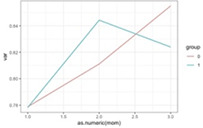
|
|||
| SD | 1.0 | 0.9 | 0.7 | 0.8 | 0.8 | 0.9 | 0.9 | 1.1 | 0.7 | 1.0 | 1.0 | 1.1 | |||||
| −0.12 | 0.36 | −0.08 | 0.03 | 0.51 | 0.29 | −0.15 | 0.32 | 0.36 | |||||||||
| p | 0.612 | 0.156 | 0.770 | 0.891 | 0.013* | 0.174 | 0.506 | 0.138 | 0.086^ | ||||||||
| WIQ | |||||||||||||||||
| WIQ distance | Mean | 25.3 | 32.1 | 70.4 | 67.6 | 70.1 | 70.8 | 44.7 | 33.6 | −4.67 | −1.9 | 46.0 | 37.0 |
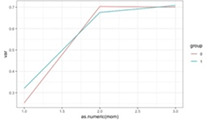
|
|||
| SD | 26.1 | 27.3 | 30.7 | 33.2 | 36.7 | 35.0 | 35.5 | 40.0 | 36.0 | 27.1 | 36.5 | 33.9 | |||||
| 0.01 | 0.20 | 0.03 | 1.31 | 1.50 | 0.47 | 0.30 | 1.78 | 1.80 | |||||||||
| p | 0.980 | 0.533 | 0.940 | <.001*** | <.001*** | 0.108 | 0.305 | <.001*** | <.001*** | ||||||||
| WIQ speed | Mean | 21.3 | 20.4 | 38.6 | 38.8 | 41.7 | 39.8 | 17.0 | 18.2 | 1.5 | −2.1 | 21.6 | 18.7 |
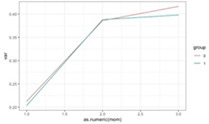
|
|||
| SD | 13.1 | 14.2 | 18.0 | 18.7 | 24.1 | 27.6 | 19.7 | 20.8 | 25.5 | 24.9 | 24.2 | 28.1 | |||||
| −0.11 | 0.03 | −0.32 | 0.82 | 0.96 | 0.38 | 0.03 | 1.20 | 0.99 | |||||||||
| p | 0.709 | 0.903 | 0.251 | <.001*** | <.001*** | 0.087^ | 0.895 | <.001*** | <.001*** | ||||||||
| WIQ stairs | Mean | 42.9 | 38.2 | 58.1 | 57.8 | 77.8 | 64.6 | 14.5 | 19.2 | 18.6 | 2.6 | 33.9 | 25.8 |
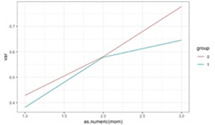
|
|||
| SD | 36.0 | 30.2 | 35.9 | 36.8 | 29.7 | 37.8 | 50.1 | 52.1 | 36.1 | 43.2 | 44.8 | 46.0 | |||||
| −0.08 | 0.12 | −0.43 | 0.76 | 0.96 | 0.74 | 0.20 | 1.50 | 1.16 | |||||||||
| p | 0.789 | 0.705 | 0.197 | 0.019* | 0.002** | 0.020* | 0.543 | <.001*** | <.001*** | ||||||||
| Treadmill walking | |||||||||||||||||
| PFWD | Mean | 150.8 | 95.6 | 292.7 | 254.5 | 320.0 | 295.3 | 143.4 | 158.9 | 13.6 | 41.2 | 165.3 | 202.5 |

|
|||
| SD | 104.6 | 73.7 | 160.4 | 160.4 | 173.7 | 230.1 | 155.2 | 140.0 | 154.5 | 152.2 | 148.2 | 218.7 | |||||
| −55.14 | −38.84 | −18.45 | 142.56 | 158.86 | 21.42 | 41.81 | 163.98 | 200.67 | |||||||||
| p | 0.119 | 0.291 | 0.635 | <.001*** | <.001*** | 0.459 | 0.153 | <.001*** | <.001*** | ||||||||
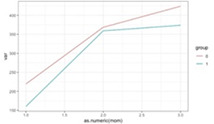
| FWD | Mean | 219.4 | 160.3 | 368.4 | 359.1 | 423. | 373.7 | 149.4 | 201.1 | 37.1 | 10.3 | 195.1 | 219.0 |
|
|||
| SD | 137.1 | 97.4 | 162.3 | 188.0 | 193.7 | 228.9 | 158.1 | 154.9 | 169.7 | 147.9 | 143.2 | 202.9 | |||||
| −59.08 | −8.26 | −39.72 | 149.19 | 200.01 | 45.71 | 14.25 | 194.9 | 214.26 | |||||||||
| p | 0.127 | 0.837 | 0.349 | <.001*** | <.001*** | 0.116 | 0.632 | <.001*** | <.001*** | ||||||||
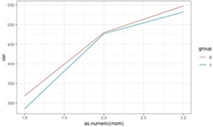
| MWD | Mean | 318.2 | 285.1 | 479.7 | 477.1 | 547.7 | 532.2 | 160.9 | 193.2 | 43.6 | 26.4 | 226.2 | 230.7 |
|
|||
| SD | 144.7 | 134.0 | 211.1 | 245.8 | 266.2 | 292.4 | 204.3 | 181.6 | 206.3 | 131.1 | 226.2 | 221.7 | |||||
| −0.15 | 0.05 | 0.04 | 0.74 | 0.94 | 0.52 | 0.50 | 1.25 | 1.44 | |||||||||
| p | 0.649 | 0.863 | 0.899 | 0.001* | <.001** | 0.017*** | 0.017* | <.001*** | <.001*** | ||||||||
| 6-minute walking | |||||||||||||||||
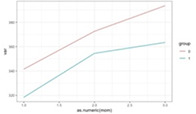
| 6MWD | Mean | 341.6 | 318.4 | 372.6 | 354.5 | 393.6 | 363.5 | 25.4 | 36.2 | 12.6 | 3.2 | 42.5 | 43.1 |
|
|||
| SD | 78.1 | 77.1 | 78.3 | 72.7 | 70.5 | 84.1 | 61.4 | 56.3 | 58.9 | 48.9 | 64.2 | 59.2 | |||||
| −23.15 | −13.94 | −24.10 | 27.00 | 36.20 | 15.84 | 5.68 | 42.83 | 41.87 | |||||||||
| p | 0.198 | 0.446 | 0.200 | 0.006** | <.001*** | 0.124 | 0.582 | <.001*** | <.001*** | ||||||||
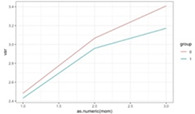
| 6MPM | Mean | 2.5 | 2.4 | 3.1 | 3.0 | 3.4 | 3.2 | 0.7 | 0.7 | 0.3 | 0.2 | 0.8 | 0.7 |
|
|||
| SD | 0.8 | 1.0 | 1.1 | 1.2 | 1.3 | 1.3 | 1.2 | 1.3 | 1.6 | 1.2 | 1.4 | 0.9 | |||||
| −0.03 | −0.07 | 0.04 | 0.45 | 0.40 | 0.02 | 0.10 | 0.43 | 0.50 | |||||||||
| p | 0.900 | 0.753 | 0.862 | 0.014* | 0.025* | 0.934 | 0.606 | 0.028* | 0.007** | ||||||||
| 6MStop | Mean | 0.9 | 1.1 | 0.5 | 0.6 | 0.3 | 0.6 | −0.5 | −0.4 | −0.2 | −0.03 | −0.6 | −0.5 |
|
|||
| SD | 1.0 | 1.4 | 0.6 | 0.8 | 0.5 | 1.1 | 1.1 | 1.5 | 0.7 | 0.8 | 0.9 | 1.4 | |||||
| 0.04 | 0.08 | 0.65 | −0.61 | −0.58 | −0.57 | 0.002 | −1.19 | −0.58 | |||||||||
| p | 0.877 | 0.832 | 0.138 | 0.018* | 0.011* | 0.146 | 0.993 | 0.001** | 0.014* | ||||||||
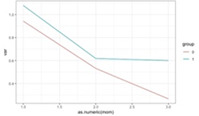
Means and graphs obtained with raw data; is the model estimate and p is the p-value provided by the corresponding regression model. PFWD: Pain-free treadmill walking distance (in meters); FWD: Functional treadmill walking distance (in meters); MWD: Maximal treadmill walking distance (in meters); 6 MWD: 6-Minute walk distance (in meters); 6MPM: 6-Minute pain distance (in minutes); 6MStop – 6-Minute number of stops. Significance: ^p < 0.1, *p < 0.05, **p < 0.01, ***p < 0.001. Number of participants (n) may differ in some rows. Significant (or marginally significant) values are highlighted in bold. Red line, CG: blue line, EG.
