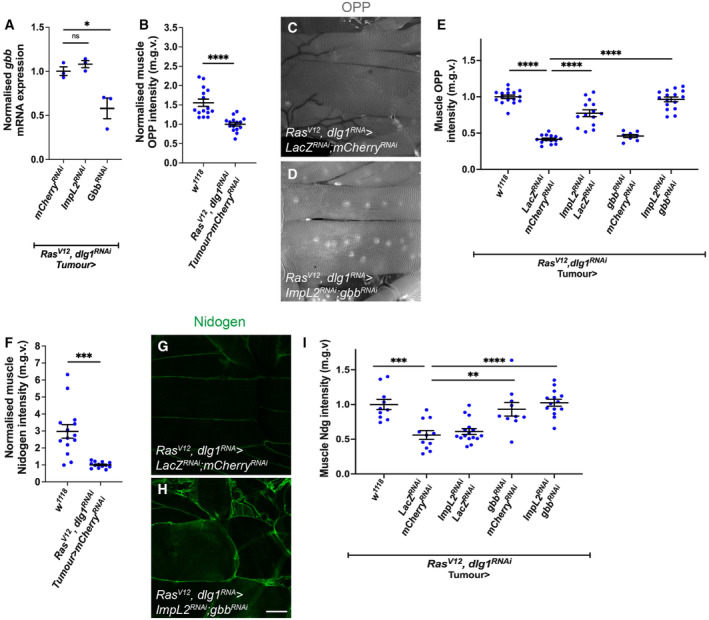
Figure EV2. Knockdown of tumour‐derived Gbb and ImpL2 rescues muscle OPP and ECM protein Nidogen.

-
ATumour qPCRs showing mRNA expression levels of gbb in Ras V12 dlg1 RNAi larvae expressing mCherry RNAi , ImpL2 RNAi , Gbb RNAi in the tumour (n = 3).
-
BQuantification of normalised muscle OPP intensity in w 1118 and Ras V12 dlg1 RNAi tumour‐bearing animals, where mCherry RNAi is specifically expressed in the tumour. w 1118 (n = 15) and Ras V12 dlg1 RNAi (n = 15).
-
C, DOPP staining detecting protein translation in the muscles of Ras V12 dlg1 RNAi tumour‐bearing animals that express lacZ RNAi ; mCherry RNAi or ImpL2 RNAi ; gbb RNAi .
-
EQuantification of OPP in the muscles of wild type w 1118 (n = 18) and tumour‐bearing animals expressing LacZ RNAi ;mCherry RNAi (n = 16), ImpL2 RNAi ; lacZ RNAi (n = 14), gbb RNAi ; mCherry RNAi (n = 8), ImpL2 RNAi ; gbb RNAi (n = 15).
-
FQuantification of normalised muscle Nidogen intensity in w 1118 and Ras V12 dlg1 RNAi tumour‐bearing animals, where mcherry RNAi is specifically expressed in the tumour. w 1118 (n = 14) and Ras V12 dlg1 RNAi (n = 13)
-
G, HNidogen staining detecting ECM localisation in the muscles of Ras V12 dlg1 RNAi tumour‐bearing animals that express lacZ RNAi ; mCherry RNAi or ImpL2 RNAi ;gbb RNAi .
-
IQuantification of Nidogen in wild type w 1118 (n = 10) and tumour‐bearing animals expressing LacZ RNAi ;mCherry RNAi (n = 11), ImpL2 RNAi ; lacZ RNAi (n = 16), gbb RNAi ; mCherry RNAi (n = 10), ImpL2 RNAi ; gbb RNAi (n = 14).
Data information: Scale bar is 50 μm. Graphs are represented as Mean ± SEM, n = the number of samples. (*) P < 0.05 (**) P < 0.01, (***) P < 0.001, (****) P < 0.0001, (ns) P > 0.05. For experiments with two genotypes, two‐tailed unpaired student's t‐tests were used to test for significant differences. The Welch's correction was applied in cases of unequal variances. For experiments with more than two genotypes, significant differences between specific genotypes were tested using a one‐way ANOVA and a subsequent Šidák post‐hoc test.
