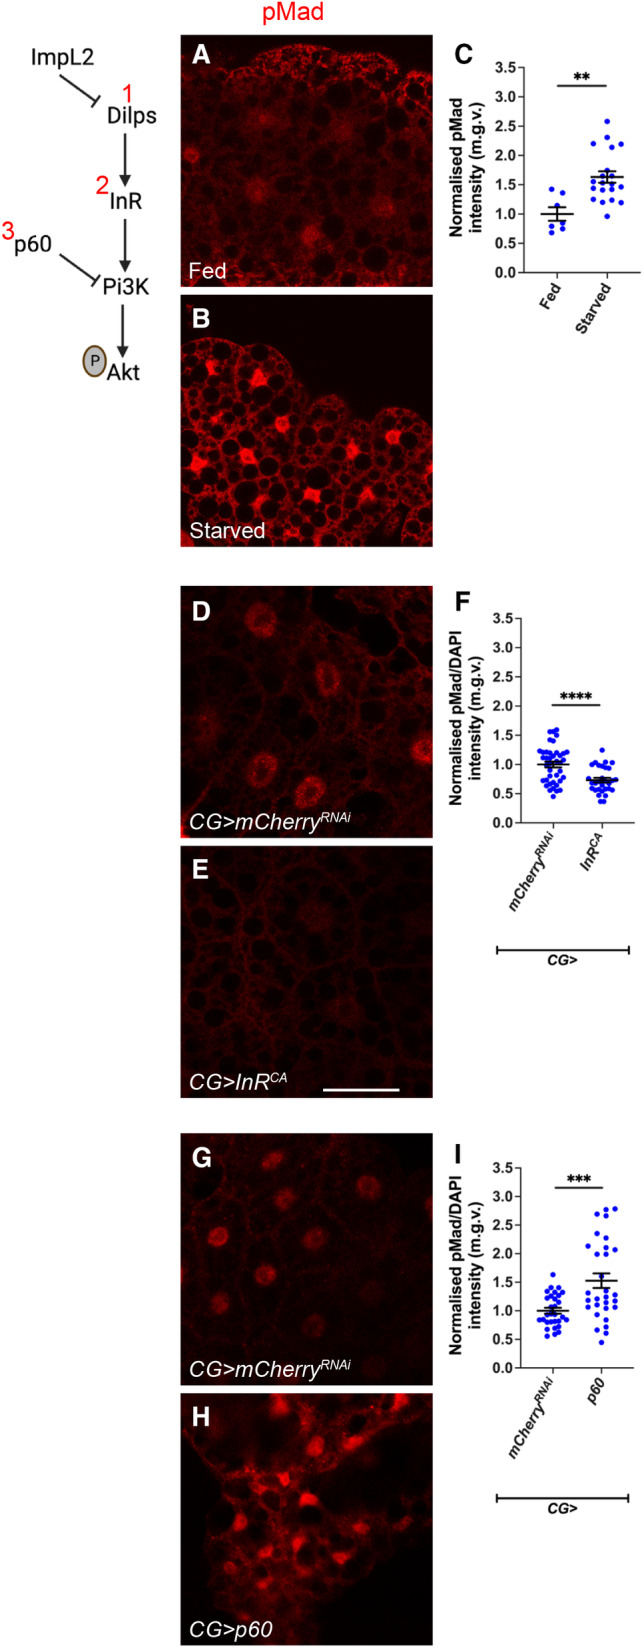
Figure 5. Fat body insulin signalling negatively regulates TGF‐ß signalling.

-
A, BFat body from fed and starved animals where Dilps level is reduced (1) with TGF‐ß signalling activation indicated by pMad staining, dissected at day 5 after larval hatching (ALH).
-
CQuantification of normalised pMad staining in (A, B). Fed (n = 7), starved (n = 20).
-
D, EFat body from animals raised at 18°C, dissected at day 7 ALH, that express mCherry RNAi or InR CA (2) under the control of CG‐GAL4, with TGF‐ß signalling activation indicated by pMad staining.
-
FQuantification of normalised pMad staining in (D, E). mCherry RNAi (n = 30), InR CA (n = 40).
-
G, HFat body from animals expressing mCherry RNAi or p60 (3) under the control of CG‐GAL4, with TGF‐ß signalling activation indicated by pMad staining, dissected at day 5 ALH.
-
IQuantification of normalised pMad staining in (G, H). mCherry RNAi (n = 30), p60 (n = 30).
Data information: Scale bar is 50 μm. Graphs are represented as Mean ± SEM, n = the number of samples. (**) P < 0.01, (***) P < 0.001, (****) P < 0.0001, two‐tailed unpaired student's t‐tests were used to test for significant differences. The Welch's correction was applied in cases of unequal variances.
Source data are available online for this figure.
