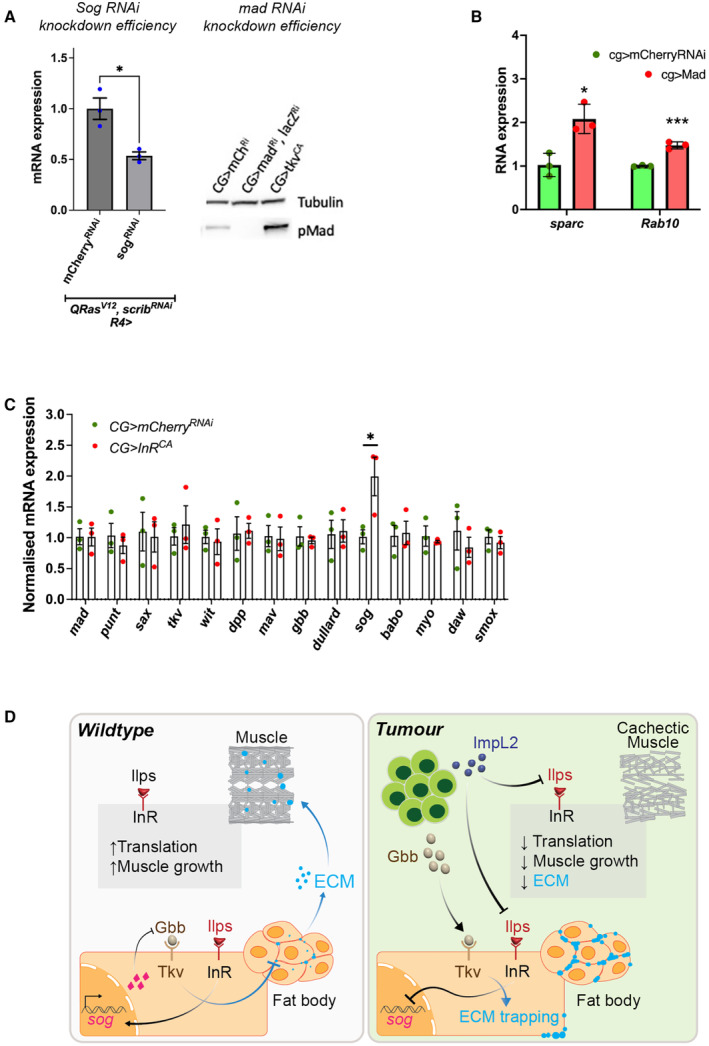
Figure EV5. Modulating fat body TGF‐ß signalling alters sparc and rab10 transcription, and modulating fat body InR alters sog transcription.

- Knockdown efficiency of sog RNAi and mad RNAi as indicated by qPCR and western blotting respectively. For qPCR, error bars represent SEM, n = 3 for biological replicates.
- Fat body qPCR showing normalised mRNA expression levels of SPARC and Rab10 upon the expression of mCherry RNAi compared to UAS‐Mad. Error bars represent SD, n = 3 for biological replicates.
- Fat body qPCRs showing normalised mRNA expression levels of TGF‐ß receptors and ligands in InR CA or mCherry RNAi larvae (raised at 18°C) with CG‐GAL4 (n = 3, biological replicates). Error bars represent SD.
- Summary diagram—Left: during development, insulin signalling in the fat body activates the transcription of sog, which inhibits Gbb and prevents the activation of TGF‐ß signalling in the fat body. This allows fat body ECM to be secreted to function in the muscle. Insulin signalling in the muscle in parallel enhances translation and muscle growth. Right: in tumour‐bearing/cachectic animals, tumours secrete two ligands: ImpL2 and Gbb. In the fat body, ImpL2 inhibits insulin signalling, preventing the transcription of sog and thus Sog can no longer inhibit Gbb. In addition, tumour secreted Gbb binds to Tkv to activate TGF‐ß signalling in the fat body, resulting in an accumulation of ECM proteins, to prevent ECM transport out of the fat body to reach the muscle. In the muscle, ImpL2 inhibits insulin signalling, which inhibits translation and muscle growth. Fat body in tumour bearing animals were dissected at day 6 after tumour induction. Fat body in non‐tumour bearing animals were dissected at day 5 ALH.
Data information: (*) P < 0.05 (**) P < 0.01, (***) P < 0.001, (****) P < 0.0001. Two‐tailed unpaired student's t‐tests were used to test for significant differences. The Welch's correction was applied in cases of unequal variances.
