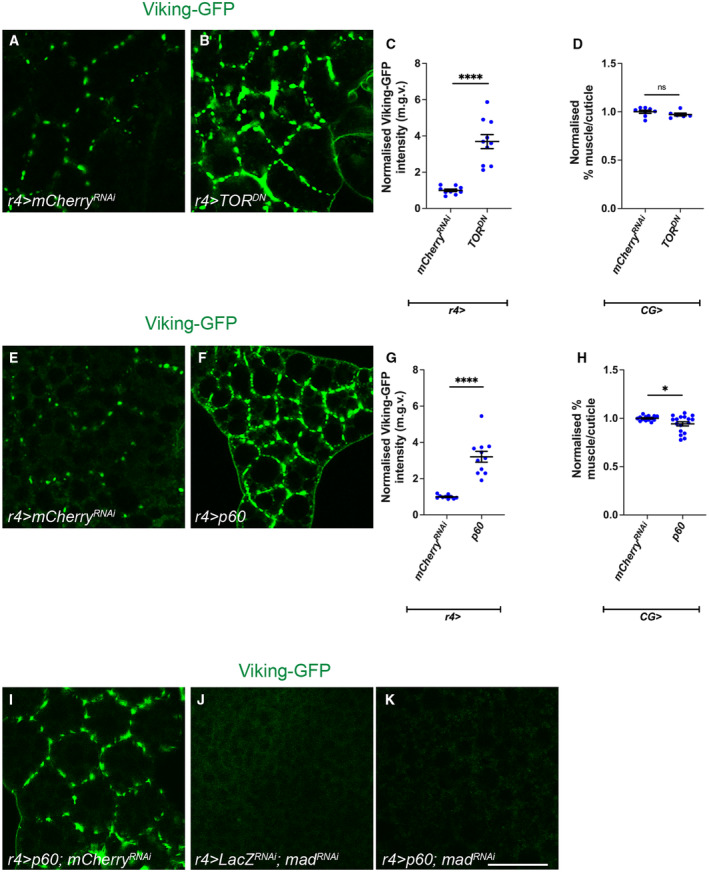
Figure 6. Fat body insulin signalling negatively regulates ECM accumulation.

-
A, BViking::GFP localisation in fat body from animals expressing mCherry RNAi or TOR DN under the control of r4‐GAL4.
-
CQuantification of normalised Viking::GFP intensity in (A, B). mCherry RNAi (n = 10) TOR DN (n = 9).
-
DQuantification of normalised muscle detachment caused by the expression of mCherry RNAi or TOR DN under the control of r4‐GAL4. mCherry RNAi (n = 8) TOR DN (n = 7).
-
E, FViking::GFP localisation in fat body from animals expressing mCherry RNAi or p60 under the control of r4‐GAL4.
-
GQuantification of normalised Viking::GFP intensity in (E, F). mCherry RNAi (n = 9), p60 (n = 10).
-
HQuantification of normalised muscle detachment caused by the expression of mCherry RNAi or p60 under the control of r4‐GAL4. mCherry RNAi (n = 12), p60 (n = 16).
-
I–KViking::GFP localisation in fat body from animals expressing p60; mCherry RNAi or lacZ RNAi ; mad RNAi or p60; mad RNAi under the control of r4‐GAL4.
Data information: Scale bar is 50 μm for fat body staining, dissected at day 5 ALH. Graphs are represented as Mean ± SEM, n = the number of samples. (*) P < 0.05 (****) P < 0.0001, (ns) P > 0.05, two‐tailed unpaired student's t‐tests were used to test for significant differences. The Welch's correction was applied in cases of unequal variances.
Source data are available online for this figure.
