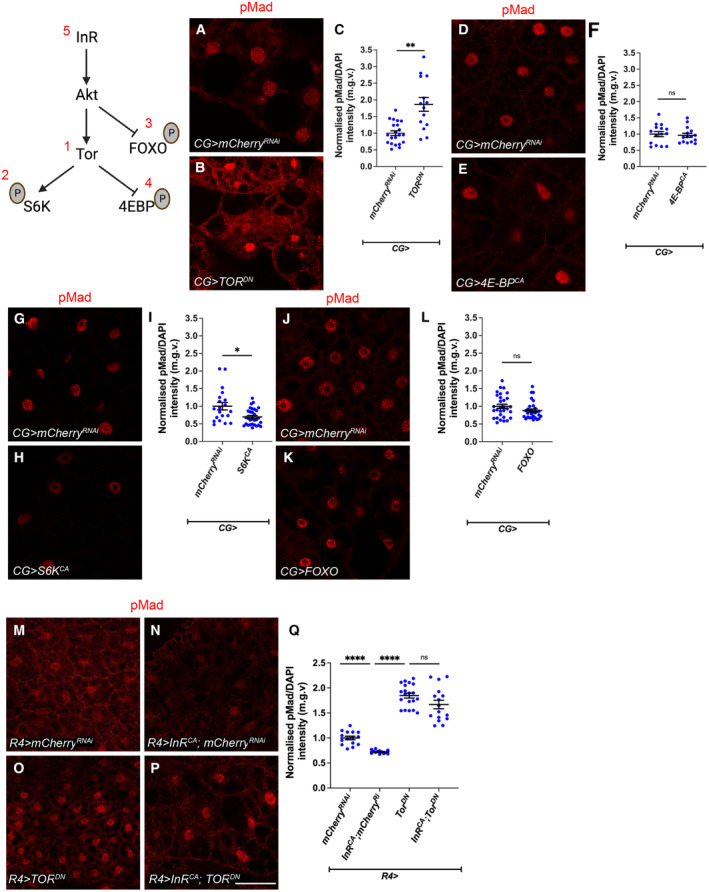
Figure 7. Fat body TOR signalling negatively regulates TGF‐ß signalling.

-
A, BFat body from animals expressing mCherry RNAi or TOR DN (1) under the control of CG‐GAL4, with TGF‐ß signalling activation indicated by pMad staining.
-
CQuantification of normalised pMad (to DAPI) staining in (A, B). mCherry RNAi (n = 21), TOR DN (n = 14).
-
D, EFat body from animals expressing mCherry RNAi or 4E‐BP CA (4) under the control of CG‐GAL4, with TGF‐ß signalling activation indicated by pMad staining.
-
FQuantification of normalised pMad staining in (D, E). mCherry RNAi (n = 15), 4E‐BP CA (n = 15).
-
G, HFat body from animals expressing mCherry RNAi or S6K CA (2) under the control of CG‐GAL4, with TGF‐ß signalling activation indicated by pMad staining.
-
IQuantification of normalised pMad staining in (G, H). mCherry RNAi (n = 20), S6K CA (n = 30).
-
J, KFat body from animals expressing mCherry RNAi or FOXO (3) under the control of CG‐GAL4, with TGF‐ß signalling activation indicated by pMad staining.
-
LQuantification of normalised pMad staining in (J, K). mCherry RNAi (n = 30), FOXO (n = 30).
-
M–PFat body from animals expressing mCherry RNAi or Tor DN (1) or InR CA ; mCherry RNAi (5) or InR CA ;Tor DN (5, 1) under the control of r4‐GAL4, with TGF‐ß signalling activation indicated by pMad staining (the same mCherry RNAi sample was used in Fig 8A, as these experiments were carried out together).
-
QQuantification of normalised pMad staining in (M–P). mCherry RNAi (n = 16), Tor DN (n = 20), InR CA ; mCherry RNAi (n = 12), InR CA ;Tor DN (n = 16). The same mCherry RNAi and InR CA ; mCherry RNAi data points were used as in Fig 8F.
Data information: Scale bar is 50 μm, dissection carried out at 5 days ALH. Graphs are represented as Mean ± SEM, n = the number of samples. (*) P < 0.05 (**) P < 0.01, (****) P < 0.0001, (ns) P > 0.05. For experiments with two genotypes, two‐tailed unpaired student's t‐tests were used to test for significant differences. The Welch's correction was applied in cases of unequal variances. For experiments with more than two genotypes, significant differences between specific genotypes were tested using a one‐way ANOVA and a subsequent Šidák post‐hoc test.
Source data are available online for this figure.
