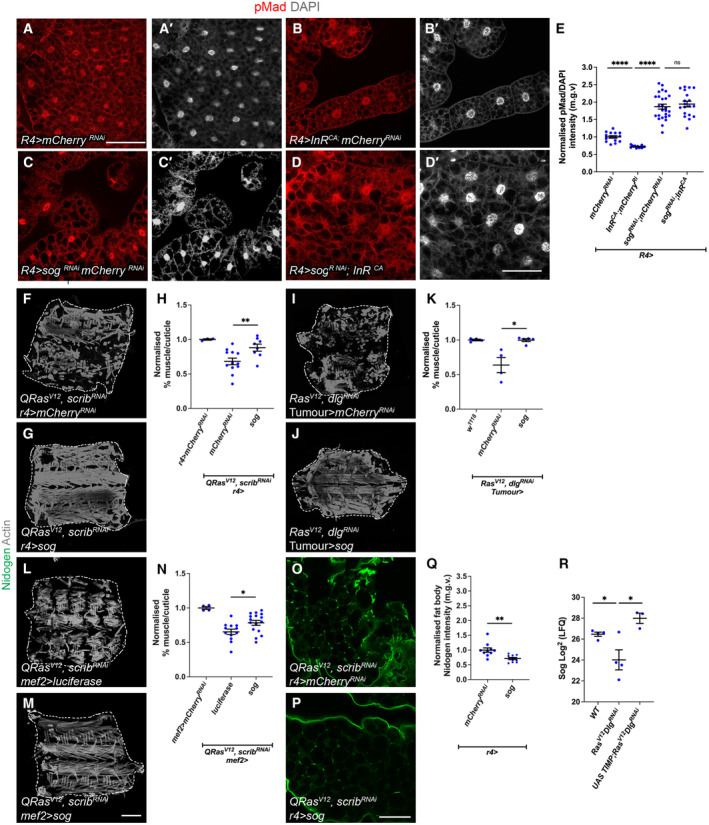
Figure 8. Insulin signalling activates the TGF‐ß inhibitor Sog.

-
A–D′Overexpression of mCherry RNAi , InR CA ; mCherry RNAi , Sog RNAi ; mCherry RNAi and Sog RNAi ;InR CA under the control of r4‐GAL4 stained for pMad and DAPI. The same mCherry RNAi sample was used in Fig 7M, as these experiments were carried out together).
-
EQuantification of pMad levels of (A–D′). mCherry RNAi (n = 17), InR CA ; mCherry RNAi (n = 7), Sog RNAi ; mCherry RNAi (n = 26), and Sog RNAi ;InR CA (n = 19), The same mCherry RNAi and InR CA ; mCherry RNAi data points were used as in Fig 6Q.
-
F, GMuscle fillets stained with phalloidin (Actin) from tumour‐bearing (QRas V12 scrib RNAi ) animals where mCherry RNAi or sog was expressed in the fat body using r4‐GAL4.
-
HQuantification of muscle detachment in (F, G). w 1118 (n = 3), mCherry RNAi (n = 10), sog (n = 8).
-
I, JMuscle fillets stained with phalloidin (Actin) from upon tumour‐specific overexpression of mCherry RNAi or Sog in Ras V12 dlg1 RNAi tumour‐bearing animals.
-
KQuantification of muscle detachment in (I, J). w 1118 (n = 3), mCherry RNAi (n = 4), sog (n = 6).
-
L, MMuscle fillets stained with phalloidin (Actin) from tumour‐bearing animals with overexpression of luciferase or sog in the muscle via MEF2‐GAL4.
-
NQuantification of muscle detachment in (L, M). w 1118 (n = 3), luciferase (n = 10), Sog (n = 16).
-
O, PFat body stained with the ECM protein Nidogen from QRas V12 scrib RNAi tumour‐bearing animals, where mCherry RNAi or UAS‐sog was expressed in the fat body (r4‐GAL4).
-
QQuantification of normalised fat body Nidogen staining in (O, P). mCherry RNAi (n = 9), UAS‐sog (n = 10). Scale bar is 50 μm for fat body.
-
RSog levels in the haemolymph of w 1118 , Ras V12 dlg1 RNAi and UAS‐TIMP; Ras V12 dlg1 RNAi tumour‐bearing animals (n = 4,4,3).
Data information: Scale bar is 200 μm for muscle fillet done at day 7 after tumour induction (F, G, I, J, L,M) and scale bar is 50 μm for fat body staining done at day 5 for wildtype fat body (A–D′) and 6 days after tumour induction (O, P). Graphs are represented as Mean ± SEM, n = the number of samples. (*) P < 0.05 (**) P < 0.01, (****) P < 0.0001, (ns) P > 0.05. For experiments with two genotypes, two‐tailed unpaired student's t‐tests were used to test for significant differences. The Welch's correction was applied in cases of unequal variances. For experiments with more than two genotypes, significant differences between specific genotypes were tested using a one‐way ANOVA and a subsequent Šidák post‐hoc test.
Source data are available online for this figure.
