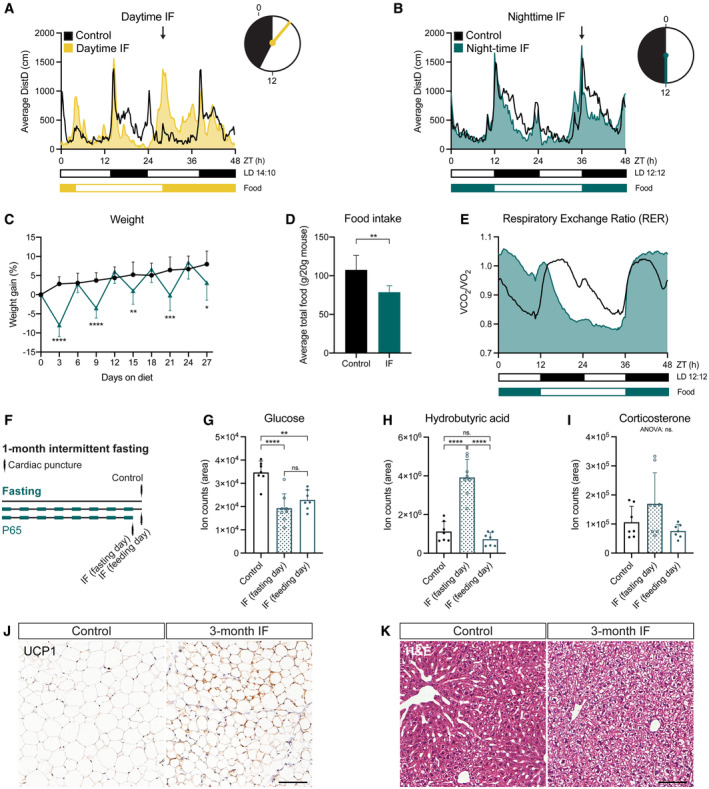
Figure 1. Night‐time IF induces systemic features of IF without disrupting the circadian activity pattern of mice.

-
A, BMouse locomotor activity in control (ad libitum, n control‐daytime = 3, n control‐night‐time=6), daytime IF (A, n = 4), and night‐time IF (B, n = 6) mice. Activity is displayed as average distance covered by mice in 48‐h cycles throughout a 1‐month long intervention. Black and white boxes under the graphs indicate respectively the dark and light phases of the light:dark (LD) cycle with zeitgeber time (ZT) 0 being the time of lights ON. Yellow/blue and white boxes indicate the presence and absence of food respectively. Arrows indicate the time of food availability onset. The clocks represent 24‐h cycles in ZT with light and dark phases filled in white and black respectively. Clock hands indicate time of food change: ZT3 for daytime IF and ZT12 for night‐time IF. Daytime IF introduces abnormal peaks of activity during the day disrupting the circadian rhythmicity of mouse activity while night‐time IF preserves their normal activity pattern.
-
CMouse weight every 3 days shown as the percentage of weight difference to the first day of the diet. Days 3, 9, 15, 21 and 27 show weight on fasting days, and days 6, 12, 18 and 24 on feeding days. Weight oscillates in feeding and fasting days. n control = 17, n IF = 18. Two‐way ANOVA P time < 0.0001, P diet = 0.0005, P int < 0.0001; followed by Šídák's multiple comparisons test; P of days 3–27 in order: < 0.0001, > 0.9999, < 0.0001, 0.6993, 0.0100, 0.8441, 0.0001, 0.8960, 0.0119.
-
DAverage total food consumed for a month shown as g of food per 20 g of mouse weight (weight reference of mice at the beginning of the diet). IF induces a mild (~ 70%) caloric restriction. n Control = 17, n IF = 18. Two‐tailed unpaired t‐test, P = 0.0013.
-
ERespiratory Exchange Ratio (RER) as a comparison of CO2 over O2 volumes. RER values close to 1 indicate predominant carbohydrate metabolism as energy fuel, while RER values close to 0.7 indicate a shift towards lipid oxidation. RER is displayed as average of 48 h cycles throughout a 1‐month long intervention. IF induces a longer shift towards lipid oxidation. n = 6 in both groups.
-
FThe serum of mice was obtained by cardiac puncture after 1 month of ad libitum eating (control) or IF. Two independent IF groups were used to collect serum on a fasting or feeding day.
-
G–ITargeted metabolomics were performed to determine the levels of glucose (G), hydrobutyric acid (H), and corticosterone (I) in the serum of mice. The area of ion counts is displayed. n control = 7, n IF(fasting day) = 8, n IF(feeding day) = 7. One‐way ANOVA, (G) P < 0.0001, (H) P < 0.0001, (I) P = 0.0613; followed by Tukey's multiple comparisons test, (H) P control‐IFfasting < 0.0001, P control‐IFfeeding = 0.0014, P IFfasting‐IFfeeding = 0.4061, (G) P control‐IFfasting < 0.0001, P control‐IFfeeding = 0.5180, P IFfasting‐IFfeeding < 0.0001.
-
JRepresentative images of UCP1‐stained inguinal adipose tissue after 3 months of IF. Adipocytes of IF mice look smaller and show a mild increase in UCP1. Images of all animals can be found in Appendix Fig S1A.
-
KRepresentative images of liver tissue stained with H&E after 3 months of IF. IF induces hepatocyte swelling. Images of all animals can be found in Appendix Fig S1B.
Data information: Bars and error bars represent average + s.d.; dots represent individual mice except in (C), where they represent the average. Significance summary: ns (or absence of sign in C), P > 0.05; *, P < 0.05; **, P < 0.01; ***, P < 0.001; ****, P < 0.0001. Scale bars: 100 μm.
Source data are available online for this figure.
