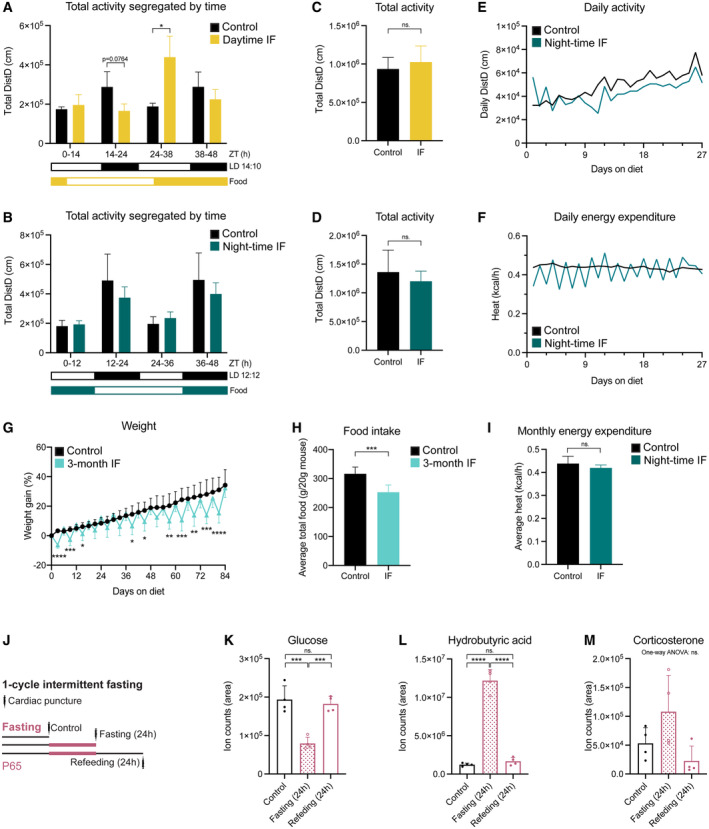
Figure EV1. Systemic effects of IF.

-
A, BMouse locomotor activity in control (ad libitum, n control‐daytime = 3, n control‐night‐time = 6), daytime IF (A, n = 4), and night‐time IF (B, n = 6) mice displayed as sum of activity during 1 month of IF segregated by time of the day (grouped according to light phase). Black and white boxes under the graphs indicate respectively the dark and light phases of the light:dark (LD) cycle with zeitgeber time (ZT) 0 being the time of lights ON. Yellow/blue and white boxes indicate the presence and absence of food respectively. Expected differences between light and dark phases were observed. Daytime IF increased locomotor activity during the feeding day while night‐time IF preserved the activity pattern. Two‐way ANOVA followed by Šídák's multiple comparisons test. See significance values in Appendix Table S3.
-
C, DTotal mouse locomotor activity during 1 month of daytime (C) or night‐time (D) IF. Two‐tailed unpaired t‐test; (C) n control‐daytime = 3, n IF‐daytime = 4, P = 0.5596, (D) n control‐night‐time = 6, n IF‐night‐time = 6, P = 0.3698.
-
E, FDaily mouse activity (E) and energy expenditure (F) over time in control and night‐time IF mice. Mice in the two conditions follow comparable trends except for daily activity during the first 3–4 days, when activity is more variable in night‐time IF mice than in control mice.
-
GMouse weight shown as the percentage of weight difference to the first day of the diet. Weight oscillations persist throughout the 3 months of IF and there is no weight loss on refeeding days compared to control mice. n control = 17, n IF = 17. Mixed‐effects analysis P time < 0.0001, P diet = 0.0215, P int < 0.0001; followed by Šídák's multiple comparisons test, see significance values in Appendix Table S4.
-
HAverage total food consumed for 3 months shown as g of food per 20 g of mouse weight (weight reference of mice at the start of the diet, P65). n control = 17, n IF = 17. Two‐tailed unpaired t‐test, P = 0.8333.
-
IMonthly energy expenditure displayed as average heat per hour. n control = 6, n IF = 6. Two‐tailed unpaired t‐test, P = 0.2141.
-
JThe serum of mice was obtained by cardiac puncture after 1 month of ad libitum eating (control) or IF. Different groups were used to collect serum after a fasting or feeding day.
-
K–MTargeted metabolomics were performed to determine the levels of glucose (K), hydrobutyric acid (L) and corticosterone (M) in the serum of mice. The area of ion counts is displayed. n control = 4, n IF(fasting day) = 4, n IF(feeding day) = 4. One‐way ANOVA, (K) P = 0.0002, (L) P < 0.0001, (M) P = 0.0515; followed by Tukey's multiple comparisons test when the ANOVA was significant, (K) P control‐IFfasting = 0.0004, P control‐IFfeeding = 0.8032, P IFfasting‐IFfeeding = 0.0008; (L) P control‐IFfasting < 0.0001, P control‐IFfeeding = 0.7749, P IFfasting‐IFfeeding < 0.0001.
Data information: Bars and error bars represent average + s.d., dots represent individual mice. Significance summary: ns, P > 0.05; *, P < 0.05; **, P < 0.01; ***, P < 0.001; ****, P < 0.0001.
