
Figure 3. Interaction of TRAP with Sec61 and the ribosome and effects of TRAP mutations for insulin biogenesis.
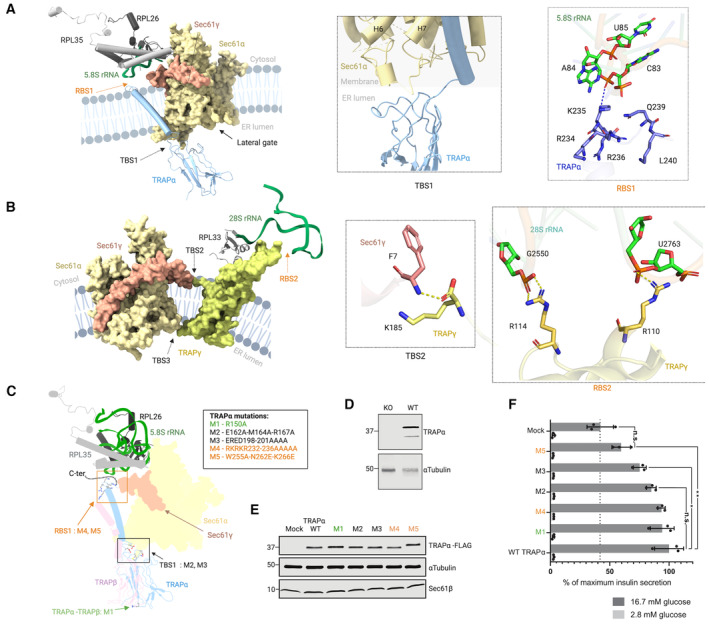
- Interactions of TRAPα with Sec61α in the lumenal region (TBS1) and with the 5.8S ribosomal RNA in the cytoplasmic region (RBS1), TRAPα is color coded according to atom (nitrogen: blue, carbon: purple, oxygen: red) as is 5.8S ribosomal RNA (carbon: green, oxygen: red, and nitrogen: blue). Hydrogen bond is highlighted with the blue dashed line.
- Interactions of Sec61γ with TRAPγ in the membrane region (TBS2), and TRAPγ with the 28S ribosomal RNA in the cytoplasmic region (RBS2), TRAPγ is color‐coded according to atom (nitrogen: blue, carbon: yellow, and oxygen: red) as is 28S ribosomal RNA (carbon: green, oxygen: red, and nitrogen: blue) and Sec61γ (nitrogen: blue, carbon: light red, and oxygen: red). Hydrogen bond is highlighted with yellow dashed line. Coloring of TRAP and Sec61 subunits and ribosomal proteins and RNA as in Fig 2.
- TRAPα residues selected in the RBS1 site (M4 and M5), TBS1 site (M2 and M3), and in the dimer interface of TRAPα and TRAPβ (M1) for mutational study. The TRAPα C‐terminal end absent in the cryo‐EM structure is shown as dashed line.
- Western blot analysis of wild‐type (WT) or TRAPα knock‐out (KO) INS‐1823/13 cells.
- Western blot analysis of transient TRAPα‐FLAG‐expressing TRAPα knock‐out INS‐1823/13 cells.
- Insulin secretion from INS‐1832/13 cells after glucose stimulation. TRAPα knock‐out INS‐1832/13 cells were transiently transfected with C‐terminally 3 × FLAG‐tagged wild‐type or mutant TRAPα‐encoding expression plasmids, and their insulin secretion was measured after stimulation with 2.8 or 16.7 mM glucose. Data are mean values ± SD from N = 3 independent experiments. Statistical significance was analyzed by unpaired T‐test, n.s. indicates no significant difference (P > 0.05). *P < 0.05. **P < 0.01.
Source data are available online for this figure.