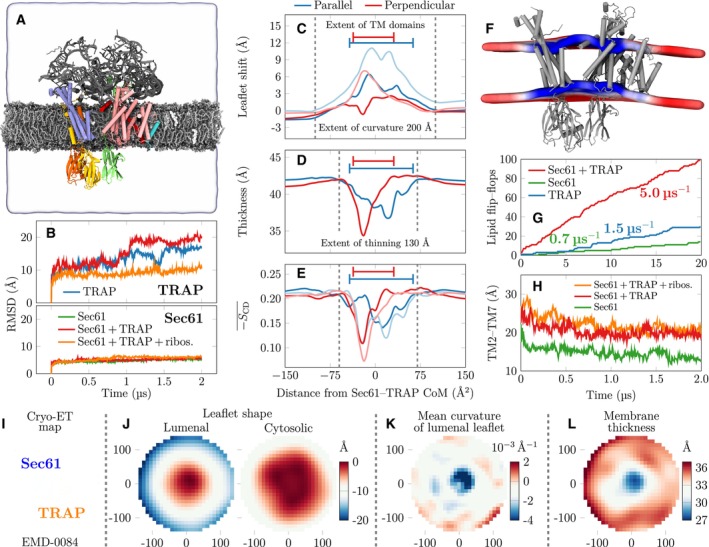
Snapshot of the initial conformation of the simulation system containing the Sec61/TRAP complex together with parts of the ribosome that interact with Sec61 or TRAP subunits. The distal parts of ribosome are restrained to model its large size without the need to model the entire ribosome. TRAP subunits are shown in green (TRAPα), yellow (TRAPβ), blue (TRAPγ), and orange (TRAPδ), whereas Sec61 subunits are shown in pink (Sec61α), cyan (Sec61β), or red (Sec61γ). The ribosomal proteins and RNA fragments included are drawn in gray. The lipids are shown in silver with gray head groups, and cholesterol in white. The extent of the simulation cell is highlighted by the transparent surface. The lipid hydrogens, water molecules, and ions are not rendered for clarity.
Root mean square deviation (RMSD) of the TRAP and Sec61 structures when simulated in different assemblies. Sec61 is always stable, yet TRAP conformation shows significant variations in the absence of ribosomal anchoring.
Quantitative characterization of membrane perturbations using g_lomepro (Gapsys
et al,
2013). The vertical shift of the lipid phosphorus atoms. The profiles were calculated parallel to the axis connecting Sec61 and TRAP and perpendicular to it. Darker lines show the upper (cytosolic) leaflet and lighter ones the lower (lumenal) leaflet. The extent of the protein TM regions is highlighted.
Membrane thickness is calculated as the difference between the phosphorus profiles of the two leaflets in (C).
Local membrane ordering calculated as the average of the deuterium order parameters of carbons 2–15 in the palmitate chains of phospholipids.
The perturbation of the membrane in the simulation containing Sec61/TRAP anchored by the ribosome contacts. The average positions of the phosphorus atoms are shown by the colored surface cut at the protein location. The color depicts local thickness, ranging from 37 Å (blue) to 43 Å (red). Average of the protein‐free control simulation was 41.8 ± 0.6 Å.
Lipid flip–flops as a proxy to membrane perturbation and permeabilization. The cumulative POPC flip–flops in the coarse‐grained simulations. In simulations with individual TRAP subunits, no flip–flops were observed, but they are promoted by the bundle of TRAPβ, TRAPγ, and TRAPδ TM domains. Sec61 alone has a minor effect, but together with TRAP the lensing effect significantly accelerates flip–flops.
The distance of the lateral gate helices TM2 and TM7 in the atomistic simulations. The presence of TRAP seems to help maintain the gate in a more open conformation.
The section of the cryo‐ET map EMD‐0084 (Pfeffer
et al,
2015; Martinez‐Sanchez
et al,
2020) in the same orientation and positioning as panels (J–L) to highlight Sec61 and TRAP positioning.
Leaflet shapes are demonstrated by the height (color) with respect to the center that is set to 0. The cytosolic leaflet is mildly curved, corresponding to the overall microsome shape, and the height shows a change of ∼10 Å at a radial distance of ∼150 Å. The lumenal leaflet shows a change of ∼20 Å over the lateral distance of ∼150 Å, indicating a significant and localized curvature.
The cytosolic leaflet has localized negative mean curvature, which in the protein vicinity (within 40 Å from the center) corresponds to a radius of curvature of ∼320 Å, in line with our MD predictions. The local high curvature is absent in the cytosolic leaflet, and the average radius of curvature of 1,300 Å likely corresponds to a typical microsome size in the sample.
The local thickness shows significant membrane thinning from the average value of 34 to ∼29 Å in the protein vicinity.

