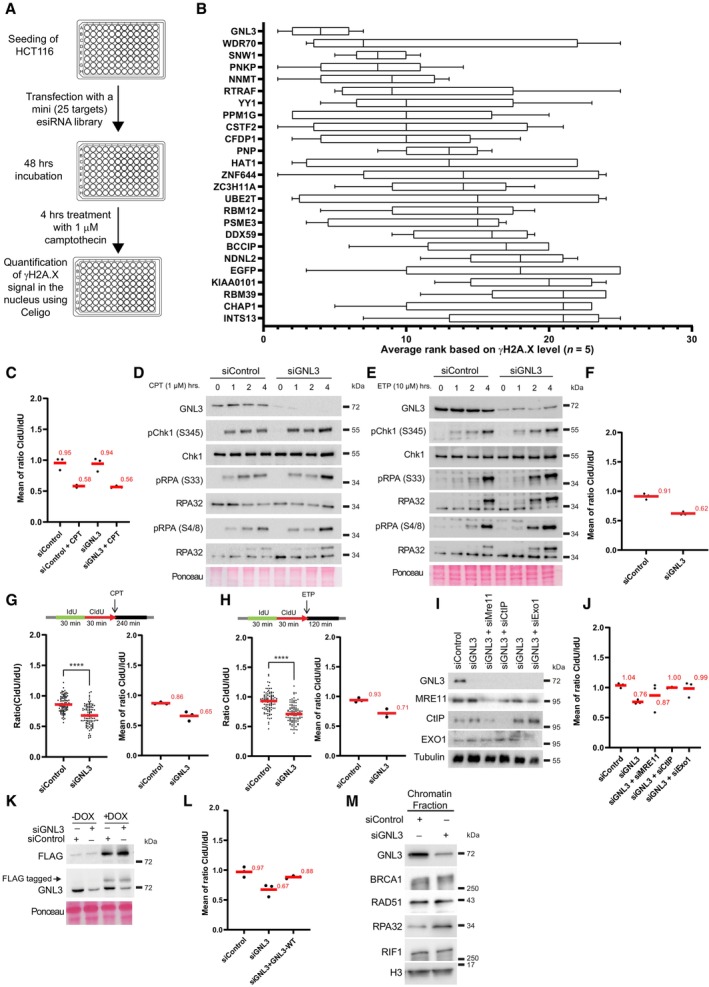
Figure EV1. GNL3 prevents DNA resection of stalled replication forks (related to Fig 1).

- Scheme explaining the mini esiRNA screen to determine the best candidates for further characterization. HCT116 cells were transfected in 96‐wells plate with each esiRNA from the library (Dataset EV1). After 48 h cells were treated with 1 μM camptothecin for 4 h and subjected to immunofluorescence using an antibody directed against γH2A.X. The level of γH2A.X within nuclei was analyzed using a Celigo high‐throughput microscope.
- The γH2A.X level upon depletion and camptothecin treatment in five biological replicates was used to rank the candidates, GNL3 was ranked first and EGFP (negative control) was ranked at the end of the list (21st). The bounds of the box are the 25th and 75th percentiles, the line in the center is the median and the bounds of the whiskers are the maxima and the minima.
- Graphic representation (related to Fig 1B) of the medians of CldU/IdU ratios in three biological replicates, the average is indicated in red.
- Western‐blot analysis of HeLa S3 cells treated with 1 μM camptothecin (CPT) during the indicated time.
- Western‐blot analysis of HeLa S3 cells treated with 10 μM etoposide (ETP) during the indicated time.
- Graphic representation (related to Fig 1D) of the medians of CldU/IdU ratios in three biological replicates, the average is indicated in red.
- HeLa S3 cells were sequentially labeled for 30 min with IdU and for 30 min with CldU then treated with 1 μM CPT for 240 min. The ratio between CldU and IdU is plotted, and the red line indicates the median. For statistical analysis, Mann–Whitney test was used; ****P < 0.0001. At least 100 individual DNA fibers was counted for each condition, the graphic representation of the medians of CldU/IdU ratios in three biological replicates with the average indicated in red is shown.
- HeLa S3 cells were sequentially labeled for 30 min with IdU and for 30 min with CldU then treated with 10 μM ETP for 120 min. The ratio between CldU and IdU is plotted, and the red line indicates the median. For statistical analysis, Mann–Whitney test was used; ****P < 0.0001. At least 100 individual DNA fibers was counted for each condition, the graphic representation of the medians of CldU/IdU ratios in three biological replicates with the average indicated in red is shown.
- Western‐blot analysis of HeLa S3 cells depleted for GNL3, MRE11, CtIP or EXO1.
- Graphic representation (related to Fig 1E) of the medians of CldU/IdU ratios in three biological replicates, the average is indicated in red.
- Western‐blot analysis of Flp‐in T‐Rex HeLa cells expressing GNL3‐WT tagged with FLAG. Cells were first transfected with siControl or siGNL3 for 48 h then expression of GNL3‐WT (resistant to the siRNA against GNL3) was induced using 10 μg/ml of doxycycline (DOX) for 16 h.
- Graphic representation (related to Fig 1F) of the medians of CldU/IdU ratios in three biological replicates, the average is indicated in red.
- Western‐blot analysis of the indicated proteins upon chromatin fractionation of Hela S3 cells treated 4 h with 5 mM HU.
Source data are available online for this figure.
