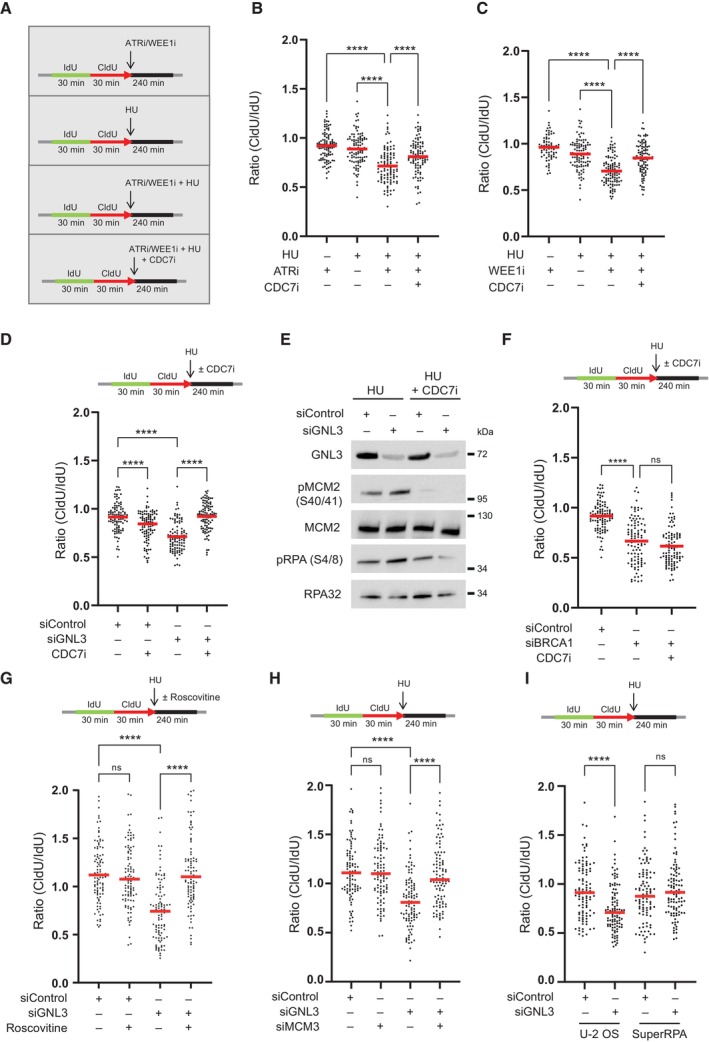
Figure 3. DNA resection in the absence of GNL3 is a consequence of increased origin firing.

- HeLa S3 cells were sequentially labeled for 30 min with IdU and for 30 min with CldU then treated or not with 5 mM HU for 240 min with or without 10 μM of ATR VE‐821 inhibitor, 500 nM of WEE1 inhibitor AZD1775 or 10 μM of CDC7 inhibitor PHA‐767491.
- The ratio between CldU and IdU is plotted, and the red line indicates the median. For statistical analysis, Mann–Whitney test was used; ****P < 0.0001. 100 individual DNA fibers were counted for each condition, and biological replicates are shown in Fig EV3B.
- The ratio between CldU and IdU is plotted, and the red line indicates the median. For statistical analysis, Mann‐Whitney test was used; ****P < 0.0001. 100 individual DNA fibers were counted for each condition, and biological replicates are shown in Fig EV3C.
- HeLa S3 was sequentially labeled for 30 min with IdU and for 30 min with CldU then treated with 5 mM HU for 240 min with or without 10 μM of CDC7 inhibitor PHA‐767491. The ratio between CldU and IdU is plotted, and the red line indicates the median. For statistical analysis, Mann–Whitney test was used; ****P < 0.0001. 100 individual DNA fibers were counted for each condition, and biological replicates are shown in Fig EV3D.
- Western‐blot analysis of the indicated proteins upon treatment with 5 mM HU for 240 min with or without 10 μM of CDC7 inhibitor PHA‐767491.
- HeLa S3 cells were sequentially labeled for 30 min with IdU and for 30 min with CldU then treated with 5 mM HU for 240 min with or without 10 μM of CDC7 inhibitor PHA‐767491. The ratio between CldU and IdU is plotted, and the red line indicates the median. For statistical analysis, Mann–Whitney test was used; ****P < 0.0001. ns, not significant. 100 individual DNA fibers were counted for each condition, andbiological replicates are shown in Fig EV3G.
- HeLa S3 cells were sequentially labeled for 30 min with IdU and for 30 min with CldU then treated with 5 mM HU for 240 min with or without 20 μM of Roscovitine. The ratio between CldU and IdU is plotted, and the red line indicates the median. For statistical analysis, Mann–Whitney test was used; ****P < 0.0001. ns, not significant. 100 individual DNA fibers were counted for each condition, and biological replicates are shown in Fig EV3H.
- HeLa S3 cells were sequentially labeled for 30 min with IdU and for 30 min with CldU then treated with 5 mM HU for 240 min. The ratio between CldU and IdU is plotted, and the red line indicates the median. For statistical analysis, Mann–Whitney test was used; ****P < 0.0001. ns, not significant. 100 individual DNA fibers were counted for each condition, and biological replicates are shown in Fig EV3J.
- Control U‐2 OS cells (U‐2 OS) or U‐2 OS cells that overexpress the three RPA subunits (SuperRPA) were sequentially labeled for 30 min with IdU and for 30 min with CldU then treated with 5 mM HU for 240 min. The ratio between CldU and IdU is plotted, and the red line indicates the median. For statistical analysis, Mann–Whitney test was used; ****P < 0.0001. ns, not significant. 100 individual DNA fibers were counted for each condition, biological replicates are shown in Fig EV3L.
Source data are available online for this figure.
