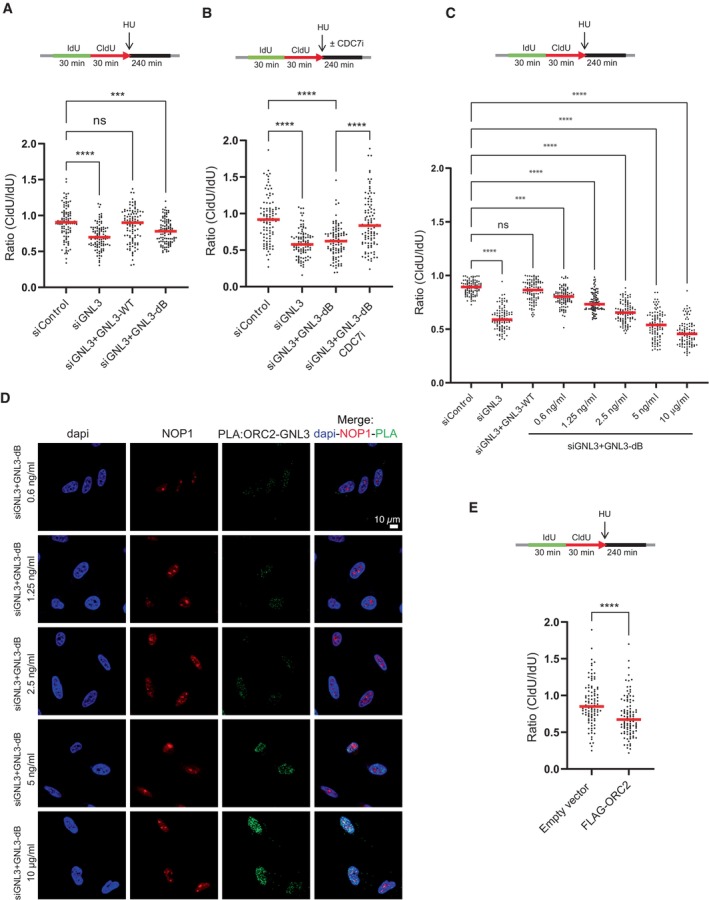
Figure 6. The control of ORC2 subnuclear localization limits DNA resection.

- Flp‐in T‐Rex HeLa cells were sequentially labeled for 30 min with IdU and for 30 min with CldU then treated with 5 mM HU for 240 min. The ratio between CldU and IdU is plotted, the red line indicates the median. For statistical analysis Mann–Whitney test was used; ****P < 0.0001; ***P < 0.001; ns non‐significant. 100 individual DNA fibers were counted for each condition, biological replicates are shown in Fig EV5D.
- Flp‐in T‐Rex HeLa cells were sequentially labeled for 30 min with IdU and for 30 min with CldU then treated with 5 mM HU for 240 min with or without 10 μM of CDC7 inhibitor PHA‐767491. The ratio between CldU and IdU is plotted, the red line indicates the median. For statistical analysis Mann–Whitney test was used; ****P < 0.0001. 100 individual DNA fibers were counted for each condition, biological replicates are shown in Fig EV5E.
- Flp‐in T‐Rex HeLa cells were sequentially labeled for 30 min with IdU and for 30 min with CldU then treated with 5 mM HU for 240 min. The ratio between CldU and IdU is plotted, the red line indicates the median. For statistical analysis Mann–Whitney test was used; ****P < 0.0001; ***P < 0.001; ns non‐significant. 100 individual DNA fibers were counted for each condition, biological replicates are shown in Fig EV5H.
- PLA (proximity ligation assay) analyzing the proximity between ORC2 and GNL3‐dB‐FLAG in HeLa Flp‐In cells treated with indicated doses of doxycycline and stained with an antibody directed against NOP1.
- Flp‐in T‐Rex HeLa cells were sequentially labeled for 30 min with IdU and for 30 min with CldU then treated with 5 mM HU for 240 min. The ratio between CldU and IdU is plotted, the red line indicates the median. For statistical analysis, Mann–Whitney test was used; ****P < 0.0001. 100 individual DNA fibers were counted for each condition, and biological replicates are shown in Fig EV5J.
Source data are available online for this figure.
