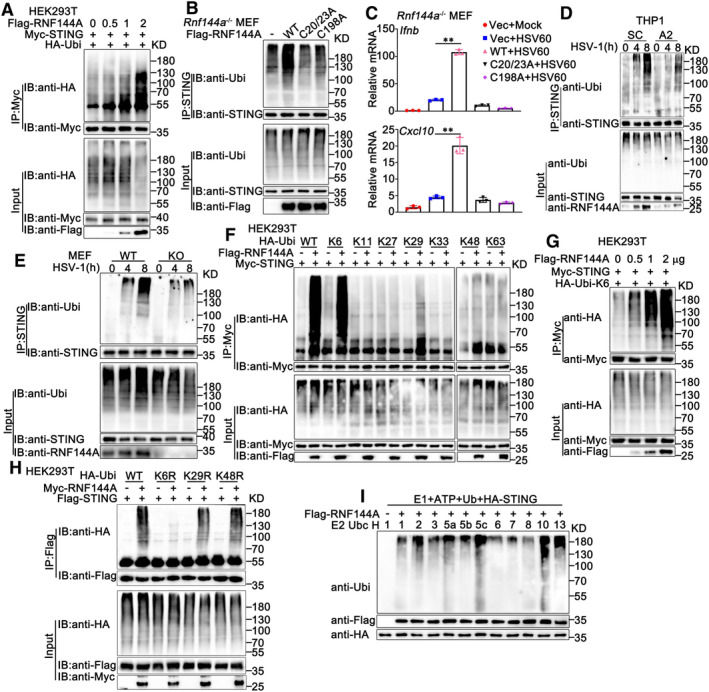
Figure 6. RNF144A promotes the ubiquitination of STING.

- HEK293T cells were transfected with the indicated plasmids and increasing amounts of Flag‐RNF144A (0, 0.5, 1, and 2 μg). At 24 h after transfection, the cells were lysed and subjected to immunoprecipitation (IP) and immunoblot (IB) assays.
- Rnf144a‐deficient (KO) MEFs were transfected with various combinations of plasmids as indicated. 24 h later, immunoprecipitation (IP) and immunoblot (IB) assays were performed.
- Rnf144a‐deficient (KO) MEFs were transfected with an empty vector (Vec), wild‐type RNF144A plasmid, or its mutants for 24 h and then transfected with HSV60 (1 μg/ml) for 8 h. The cells were then lysed for real‐time PCR assays.
- PMA‐THP1 cells were transfected with control siRNA (SC) or RNF144A‐specific siRNA (A2). At 24 h after transfection, the cells were infected with HSV‐1 (MOI = 1) for the indicated periods. Afterward, immunoprecipitation (IP) and immunoblot (IB) assays were performed.
- Wild‐type (WT) and Rnf144a‐deficient (KO) MEFs were infected with HSV‐1 (MOI = 1) for the indicated periods. Afterward, immunoprecipitation (IP) and immunoblot (IB) assays were performed.
- HEK293T cells were transfected with various combinations of plasmids as indicated. 24 h later, immunoprecipitation (IP) and immunoblot (IB) assays were performed.
- HEK293T cells were transfected with the indicated plasmids and increasing amounts of Flag‐RNF144A (0, 0.5, 1, and 2 μg). At 24 h after transfection, the cells were lysed and subjected to immunoprecipitation (IP) and immunoblot (IB) assays.
- HEK293T cells were transfected with various combinations of plasmids as indicated. 24 h later, immunoprecipitation (IP) and immunoblot (IB) assays were performed.
- Immunoblot analysis of STING ubiquitination in vitro. STING and wild‐type RNF144A were quickly translated in vitro, and then the biotin‐ubiquitin E1 and indicated E2s were added for the in vitro ubiquitination assays.
Data information: Two‐tailed unpaired Student's t‐test, **P < 0.01. Data shown are representative of at least three independent biological replicates. In (C), each data point represents a technical replicate. Error bars are presented as mean ± SD.
Source data are available online for this figure.
