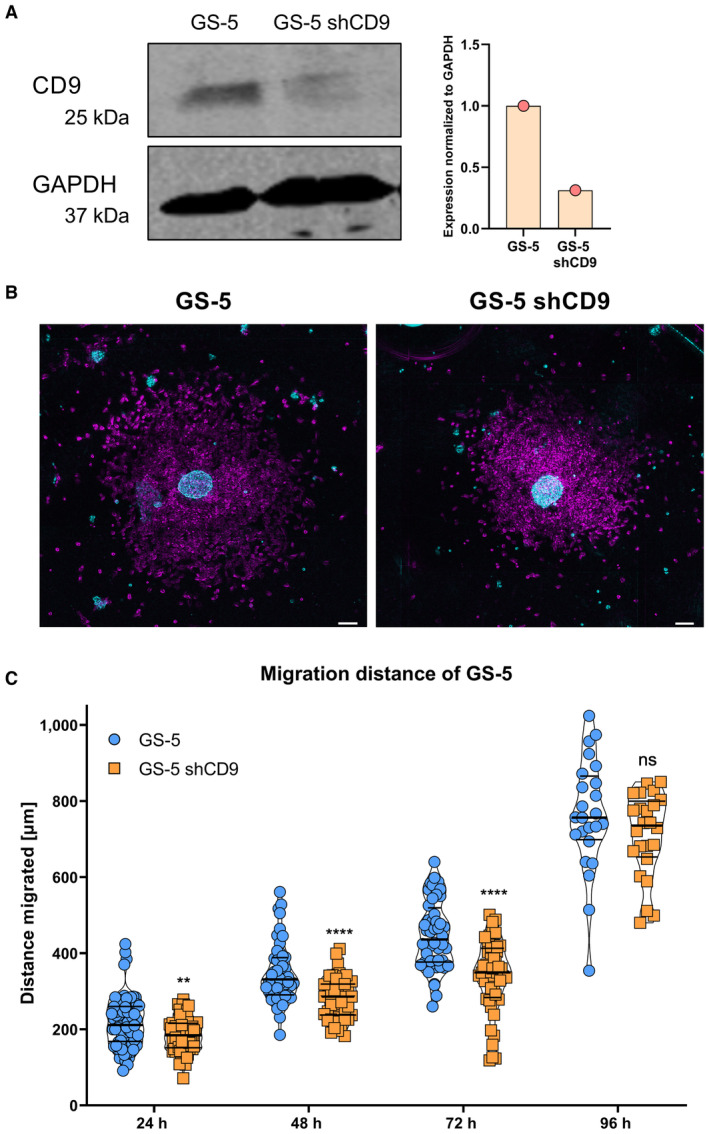
Figure EV2. CD9 depletion leads to reduced migration in GS‐5 GSCs.

- The expression of CD9 in GS‐5 GSCs after lentiviral transduction of a shCD9 plasmid was analyzed via Western blot and quantified in relation to GAPDH expression (n = 1).
- False‐color images of the sphere migration assay of GS‐5 and GS‐5 shCD9 GSCs. Time points are displayed for 0 h (false color, cyan) and 48 h (false color, magenta). Scale bars: 100 μm.
- Quantification of the sphere migration assay of GS‐5 and GS‐5 shCD9 GSCs showed difference in migration upon CD9 depletion. The experiment was performed independently at least three times with eight replicates (n ≥ 24 biological replicates).
Data information: In (C), data are presented as mean ± SEM. ns, not significant; **P < 0.01; ****P < 0.0001 against GS‐5 (unpaired T‐test with Mann–Whitney test, GraphPad Prism 9).
