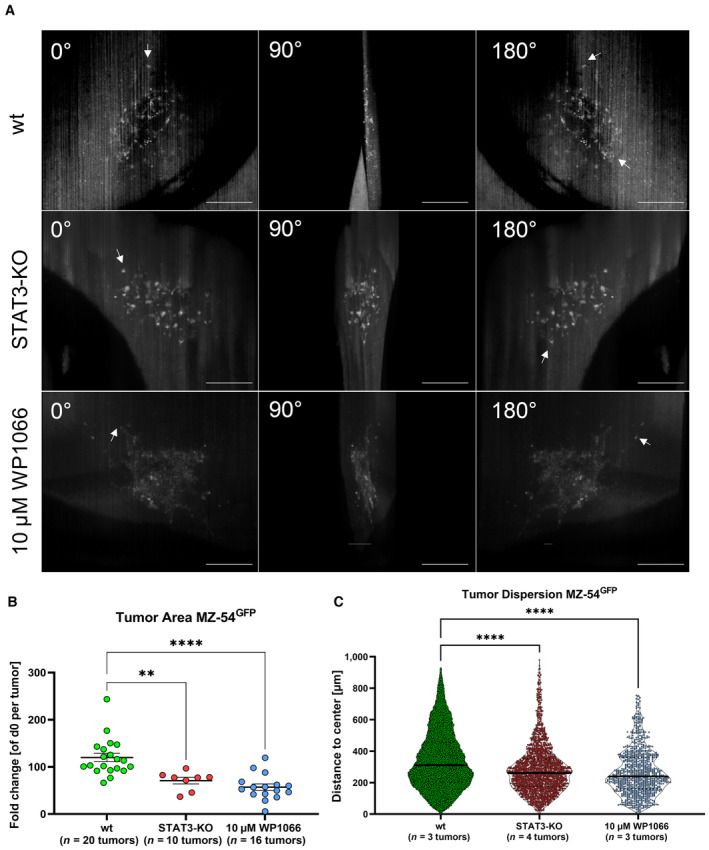
Figure EV3. Genetically STAT3 depletion and pharmacological JAK2/STAT3 inhibition affect tumor growth in ex vivo organotypic tissue culture in MZ‐54 cells.

- Montages of 3D reconstruction of light‐sheet images displayed in 90° angles of the same tumor at the latest time point (d5) of MZ‐54 wt, MZ‐54 STAT3‐KO or MZ‐54 wt treated with 10 μM WP1066. Arrows display cells which reached their overall maximal migration distance. Scale bars 200 μm.
- Point plot depicting individual fold‐changes tumor sizes at the latest time point (d5) generated from epifluorescence microscopy of MZ‐54 wt (n = 20 tumors), MZ‐54 STAT3‐KO (n = 10 tumors), and MZ‐54 wt treated with 10 μM WP1066 (n = 16 tumors), being biological replicates for each condition.
- Violin plot depicting single tumor cell dispersion at the latest time point (d5) generated from light‐sheet images of MZ‐ 54. wt n = 3 tumors (n = 103,314 single cells), MZ‐54 STAT3‐KO n = 4 tumors (n = 2040 single cells), and MZ‐54 treated with 10 μM WP1066 n = 3 tumors (n = 932 single cells), each point represents one tumor cell.
Data information: In (B, C), data are presented as mean ± SEM. **P < 0.01; ****P < 0.0001 against MZ‐54 wt (unpaired T‐test with Mann–Whitney test, GraphPad Prism 9).
