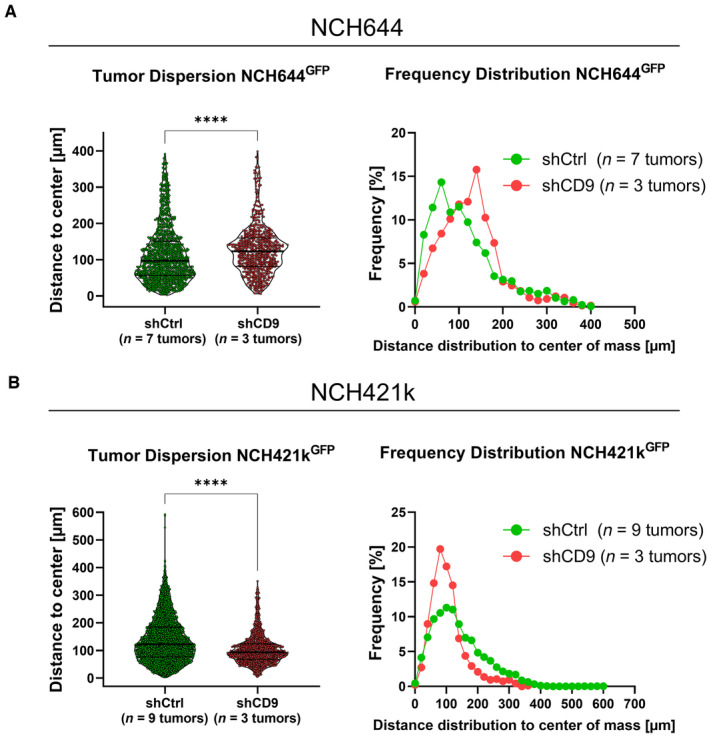
Figure EV4. Quantification of confocal generated pictures observing CD9 depletion performing ex vivo organotypic tissue culture using GSC line NCH644 and NCH421k shCtrl and shCD9.

- Violin plot depicting single tumor cell dispersion, each point represents one tumor cell, for NCH644 shCtrl (n = 7 tumors and n = 1,247 single cells) and shCD9 (n = 3 tumors and n = 671 single cells). Frequency distribution showing the relative amount of migration distance in 25 μm bins of NCH644 tumors.
- Violin plot depicting single tumor cell dispersion, each point represents one tumor cell for NCH421k shCtrl (n = 9 tumors and n = 3,345 single cells) and shCD9 (n = 3 tumors and n = 958 single cells). Frequency distribution showing the relative amount of migration distance in 25 μm bins of NCH421k tumors.
Data information: In (A, B), data are presented as mean ± SEM. ****P < 0.0001 against shCtrl cells (unpaired T‐test with Mann–Whitney test, GraphPad Prism 9).
