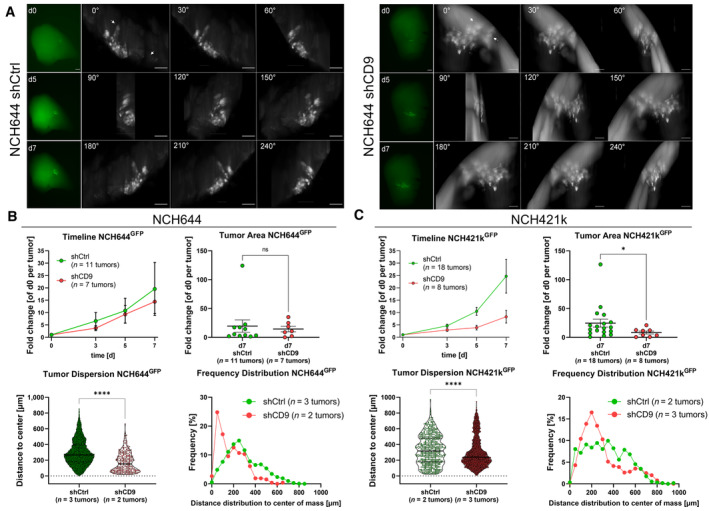
Figure 5. CD9 depletion affects tumor growth in ex vivo organotypic tissue culture tumor growth kinetics in NCH644 and NCH421k GSCs.

- Epifluorescence microscopic pictures (left panels, green) of the same tumor of NCH644 shCtrl or shCD9 after 0, 5, and 7 days of incubation. Scale bars 200 μm. The montage of 3D reconstruction LSFM image displays the same tumor at the latest time point (d7) of incubation for NCH644 shCtrl or shCD9 in 30° angles (right panels, gray). Arrows display cells that reached their overall maximal migration distance. Scale bars 100 μm. 360° videos of the LSFM images are provided as source data.
- Evaluation of the epifluorescence pictures for NCH644 (shCtrl n = 11 tumors and shCD9 n = 7 tumors; being biological replicates), the summarized growth kinetic over the entire observation time (timeline), and point plot depicting individual fold‐changes tumor sizes (tumor area) at the latest time point (d7). For the evaluation of the light‐sheet images, single cells were measured from biological replicates of n = 3 tumors of shCtrl (n = 9,604 single cells) and n = 2 tumors of shCD9 (n = 262 single cells) NCH644 GSCs. Violin plot depicting tumor dispersion; each point represents one tumor cell and frequency distribution showing the relative amount of migration distance in 50 μm bins.
- Evaluation of the epifluorescence pictures for NCH421k (shCtrl n = 18 tumors and shCD9 n = 8 tumors; being biological replicates), the summarized growth kinetic over the entire observation time (timeline), and point plot depicting individual fold‐changes tumor sizes (tumor area) at the latest time point (d7). For the evaluation of the light‐sheet images, single cells were measured from biological replicates of n = 2 tumors of NCH421k shCtrl (n = 572 single cells) and n = 3 tumors of NCH421k shCD9 (n = 6,047 single cells) GSCs. Violin plot depicting tumor dispersion, each point represents one tumor cell and frequency distribution showing the relative amount of migration distance in 50 μm bins.
Data information: In (B, C), data are presented as mean ± SEM. ns, not significant; *P < 0.05; ****P < 0.0001 against shCtrl cells (unpaired T‐test with Mann–Whitney test, GraphPad Prism 9).
Source data are available online for this figure.
