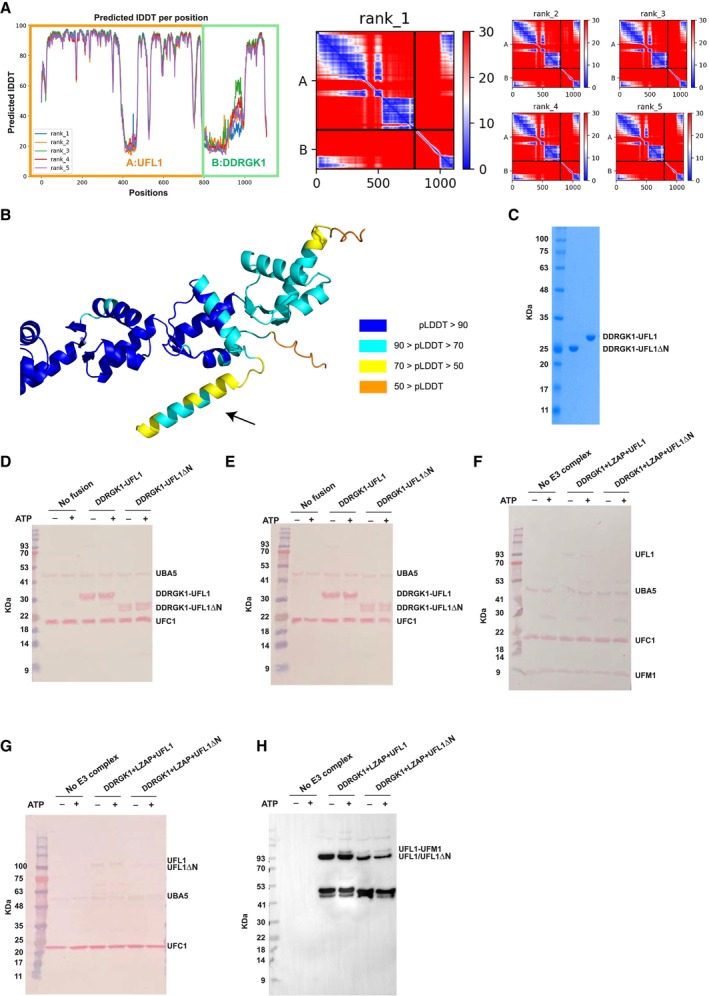
Figure EV1. The UFL1‐DDRGK1 complex.

- A
-
BModel of the DDRGK1‐UFL1 complex, colored according to pLDDT, highlighting the lower confidence in the structure of the N‐terminal helix.
-
CSDS–PAGE showing the purity of the indicated fusion proteins.
-
D–HLoading controls of in vitro ufmylation assays (accompanies Fig 1E–H). (D, E) fusion constructs, (F, G) ternary complex. (H) Presence of UFL1/UFL1ΔN in the membrane: Since we hardly see UFL1/UFL1ΔN in the Ponceau staining (F), we performed Western blot analysis with anti‐Myc. All reactions were loaded on bis‐Tris‐PAGE (except the reaction of Fig 1G, which was loaded on 8–16% Tris gel).
