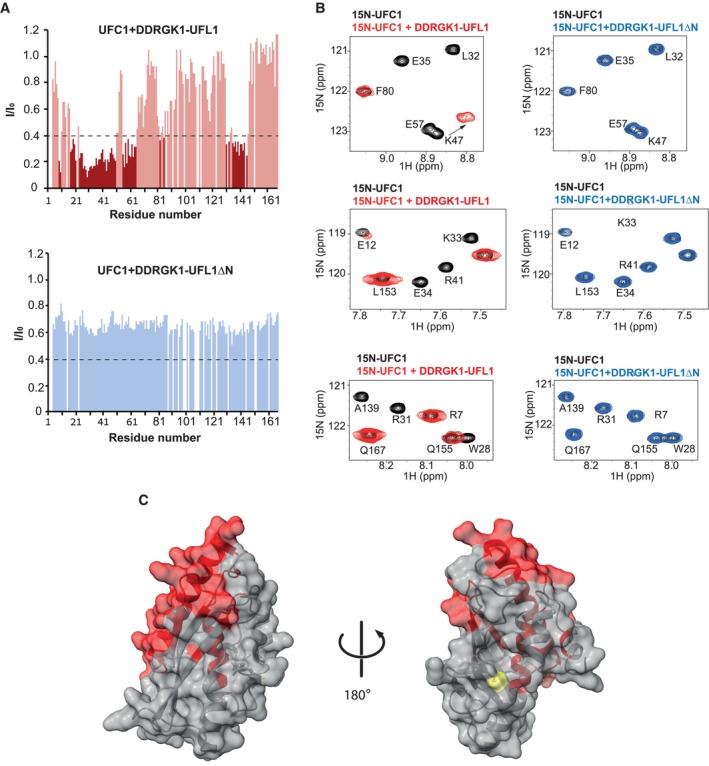
Figure 3. Characterization of UFC1 binding to DDRGK1‐UFL1 using NMR.

- Intensity changes of UFC1 residue peaks upon addition of 1.5‐fold excess (300 μM) of DDRGK1‐UFL1 (upper graph) or 2‐fold excess (400 μM) of DDRGK1‐UFL1ΔN (lower graph). Dark colors indicate shifted residues (I/I0 ≤ 0.4), and light colors indicate unshifted residues (I/I0 > 0.4). Removal of the N‐terminal UFL1 regions significantly impairs UFC1‐DDRGK1‐UFL1 complex formation. The dashed line indicates I/I0 = 0.4.
- Selected regions of the 1H–15N HSQC spectrum: 0.2 mM UFC1 alone (black) and in the presence of twofold excess of DDRGK1‐UFL1 (red) or DDRGK1‐UFL1ΔN (blue).
- Structure of UFC1 [PDB ID: 7NW1 (Kumar et al, 2021)] with residues displaying significant intensity changes (I/IO ≤ 0.4) upon addition of DDRGK1‐UFL1 colored in red; UFC1 active site cysteine labeled in yellow.
Source data are available online for this figure.
