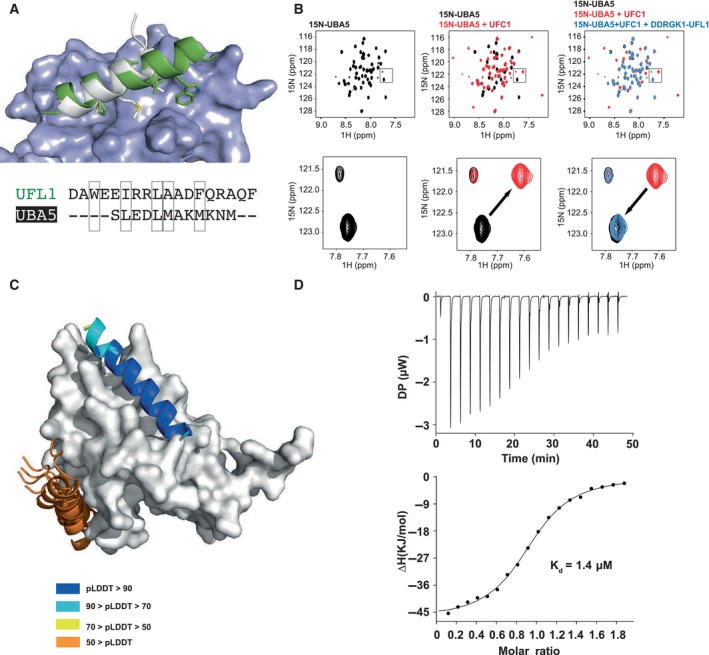
Figure 4. UBA5 and UFL1 compete for binding to UFC1.

- Superposition of the model of the UFL1 N‐terminal helix‐UFC1 complex onto the solved structure of the UBA5 N‐terminal helix‐UFC1 complex (PDB ID: 7NW1) suggests that both bind to the same binding site; UFC1 is shown in surface representation, UFL1 (green), UBA5 (white).
- NMR 1H–15N HSQC spectra revealing competitive binding: Left: 1H–15N HSQC spectrum of 15N UBA5 alone (150 μM, black); Center: Overlay of spectrum after addition of UFC1 (300 μM, red); Right: Overlay of spectrum after addition of both UFC1 (300 μM) and DDRGK1‐UFL1 (700 μM, blue), showing return to the unbound spectra. Upper panel: Full spectrum; Lower panel: Inset focusing on a specific peak, showing its shift in the presence of UFC1, which is reverted after addition of competing UFL1.
- Computational competition assay using AlphaFold2 modeling of the structure of UFC1 in the presence of both helices (N‐terminal helix of UFL1 and C‐terminal helix of UBA5) identifies UFL1 as the stronger binder, forcing UBA5 to another, incorrect location. Note the high pLDDT for the UFL1 helix, compared to the corresponding pLDDT values for UBA5. See also Fig EV3.
- ITC experiment of UFC1 binding to UFL1 N‐terminal helix (1–21). The top graph represents raw data of heat flow versus time. The area under the peaks of the upper panel was integrated and plotted as kJ per mole of UFC1 as a function of binding stoichiometry in the bottom panel. Thermodynamic parameters are summarized in Table EV3.
Source data are available online for this figure.
