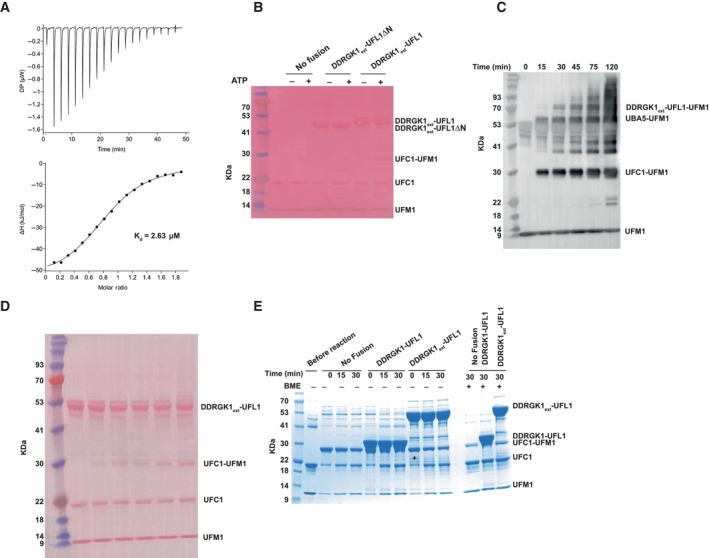
Figure EV4. Binding and activity characterization of DDRGK1ext‐UFL1.

- ITC experiment of UFC1 binding to DDRGK1ext‐UFL1. The top graph represents raw data of heat flow versus time. The area under the peaks of the upper panel was integrated and plotted as kJ per mole of UFC1 as a function of binding stoichiometry in the bottom panel. Thermodynamic parameters are summarized in Table EV3.
- Loading control of in vitro ufmylation assay (accompanies Fig 5D).
- In vitro ufmylation assay in the presence of DDRGK1ext‐UFL1. Western blot analysis of ufmylated products as function of time (blotting with anti‐FLAG, since UFM1 has an FLAG‐tag).
- Loading control of (C).
- Single turnover lysine discharge assay showing the effect of DDRGK1‐UFL1 or DDRGK1ext‐UFL1 on discharge of UFC1 by free lysine.
