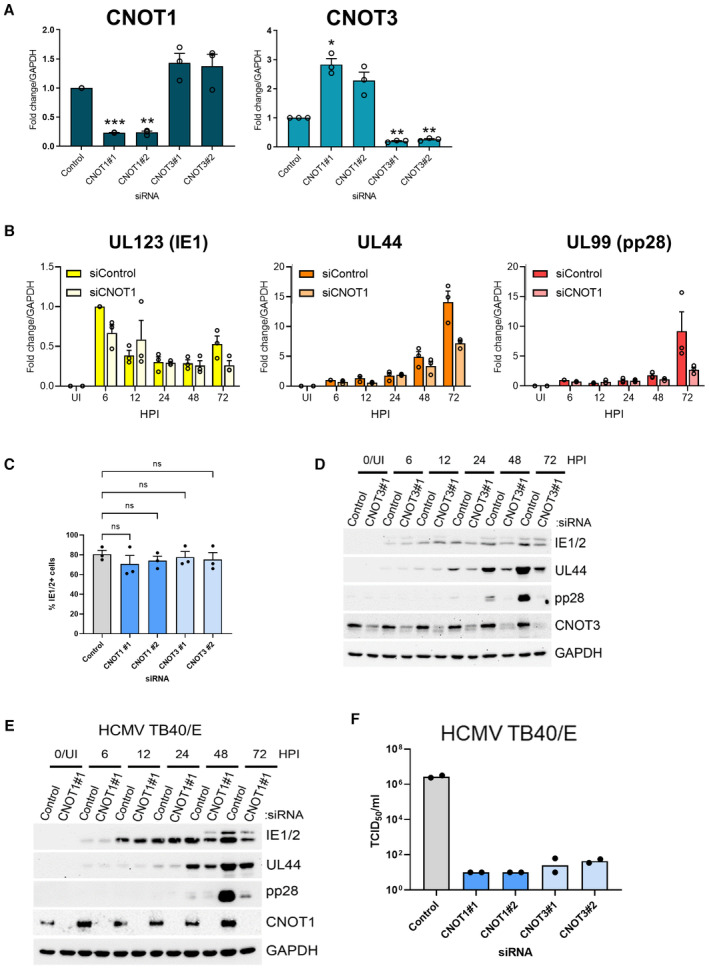
Figure EV2. CNOT1 and CNOT3 promote viral gene expression late in HCMV infection.

- RT‐qPCR analysis for CNOT1 and CNOT3 mRNAs from RNA isolated from uninfected cells treated as in Fig 2A. Mean fold changes relative to GAPDH ± SEM (n = 3 biological replicates) are plotted with statistical significance established by ANOVA test with Dunnett multiple comparison correction compared control siRNA treated samples; (*) P < 0.033, (**) P < 0.002, (***) P < 0.001, no asterisk: not significant.
- RT‐qPCR analysis for viral mRNAs from RNA isolated from cells siRNA‐transfected and infected with HCMV AD169 as in Fig 2C. Protein names, where different from gene names, indicated in brackets. Mean fold changes relative to GAPDH ± SEM (n = 3 biological replicates) are plotted, normalized to siControl 6 HPI samples.
- Cells stained positively for IE1/2 expression by immunofluorescence were scored at 6HPI following infection (MOI: 3) of control and CNOT1/3 siRNA‐transfected NHDFs. Mean % IE1/2 positive cells are plotted ± SEM (n = 3 biological replicates). No significant (ns) differences between control and knockdown cells were identified by ANOVA test with Dunnett multiple comparison correction.
- Immunoblot analysis of lysates from NHDF cells transfected with control or CNOT3 siRNA (#1) and infected with HCMV AD169 at MOI = 3 and analyzed as in Fig 2C.
- Immunoblot analysis of lysates from NHDF cells transfected with control or CNOT1 siRNA (#1) and infected with HCMV TB40/E at MOI = 3 and analyzed as in Fig 2C.
- Titer of infectious released virus was determined by TCID50 on supernatants of cells transfected with the indicated siRNAs and infected with HCMV clinical strain TB40/E at MOI = 0.05 and incubated for 7 days. Mean TCID50/ml of two biological experiments shown.
