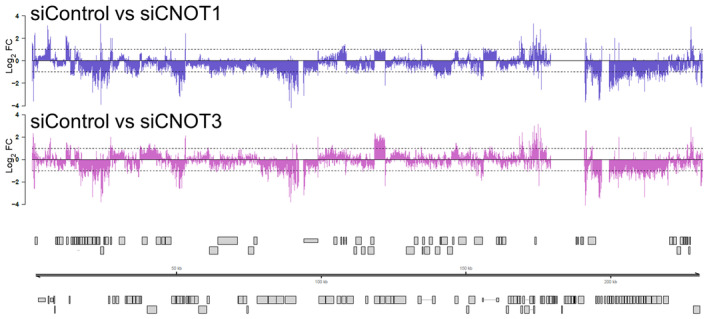
Figure EV3. Comparison of viral transcript genomic distribution in control vs. CNOT1/3 knockdown cells.

The distribution of 50,000, randomly sampled viral reads was compared between infected siControl and siCNOT1 cells (upper panel) and siControl and siCNOT3 cells (lower panel) and log2 fold change plotted across the viral genome. Canonical HCMV ORFs are shown as gray boxes.
